
Always a class act on and off the field. Here's a nice article on the scouting and signing of both Sandberg and Boggs by Tracy Ringolsby.
Name Opp Bases EB IB OA IBP
1 Jack Wilson 117 203 179 24 1 1.14
2 Mike Cameron 168 286 252 34 2 1.14
3 Raul Mondesi 112 190 168 22 1 1.13
4 Chris Singleton 112 192 171 21 2 1.12
5 Juan Pierre 259 411 367 44 4 1.12
6 Vernon Wells 104 175 157 18 4 1.12
7 Jay Payton 168 280 252 28 3 1.11
8 Ray Durham 203 334 301 33 0 1.11
9 Torii Hunter 170 279 252 27 3 1.11
10 Cristian Guzman 209 349 315 34 3 1.11
11 Carlos Beltran 208 346 313 33 0 1.10
12 David Eckstein 216 352 319 33 3 1.10
13 Jimmy Rollins 180 297 269 28 1 1.10
14 Jose Valentin 139 232 211 21 2 1.10
15 Barry Larkin 140 237 216 21 0 1.10
16 Luis Castillo 272 450 410 40 4 1.10
17 Larry Walker 173 288 263 25 2 1.10
18 Tony Womack 194 313 286 27 5 1.10
19 Royce Clayton 134 232 212 20 2 1.09
20 Rafael Furcal 201 329 301 28 2 1.09
21 Edgar Renteria 210 338 310 28 4 1.09
22 Orlando Cabrera 162 273 250 23 2 1.09
23 Brian Roberts 124 197 180 17 2 1.09
24 Alfonso Soriano 118 185 170 15 2 1.09
25 Steve Finley 194 320 295 25 2 1.09
26 Luis Rivas 137 223 206 17 1 1.08
27 Carlos Guillen 176 285 263 22 1 1.08
28 Alex Rodriguez 209 345 319 26 6 1.08
29 Melvin Mora 185 304 281 23 5 1.08
30 Jeff Cirillo 123 204 189 15 5 1.08
31 Cesar Izturis 123 194 180 14 1 1.08
32 Johnny Damon 256 420 390 30 3 1.08
33 Marquis Grissom 131 213 198 15 2 1.08
34 Eric Chavez 176 287 267 20 1 1.07
35 Darin Erstad 210 348 325 23 6 1.07
36 Scott Rolen 209 347 324 23 2 1.07
37 Michael Young 148 238 223 15 2 1.07
38 Andruw Jones 206 338 317 21 4 1.07
39 Albert Pujols 174 287 269 18 6 1.07
40 Derek Jeter 248 399 375 24 2 1.07
41 Todd Helton 230 384 361 23 4 1.06
42 Brian Giles 199 321 302 19 2 1.06
43 Eric Hinske 106 169 159 10 2 1.06
44 Preston Wilson 120 192 181 11 2 1.06
45 Terrence Long 181 285 269 16 2 1.06
46 Reed Johnson 111 173 163 10 1 1.06
47 Neifi Perez 156 253 239 14 3 1.06
48 Kenny Lofton 206 322 305 17 5 1.06
49 Gabe Kapler 120 189 179 10 4 1.06
50 Ron Belliard 196 302 286 16 4 1.05
51 Chipper Jones 203 327 310 17 3 1.05
52 Jeff Bagwell 214 347 330 17 2 1.05
53 Jose Offerman 122 195 185 10 4 1.05
54 Raul Ibanez 132 215 204 11 2 1.05
55 Aaron Boone 110 169 161 8 1 1.05
56 Rey Sanchez 145 219 210 9 4 1.04
57 Roberto Alomar 183 286 274 12 2 1.04
58 Randy Winn 191 297 285 12 2 1.04
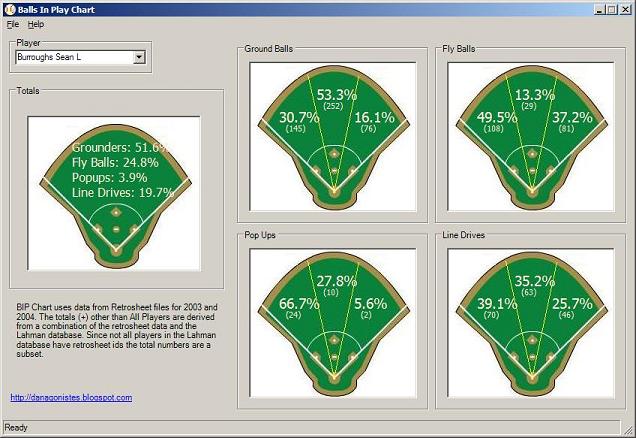
59 Sean Burroughs 108 165 158 7 2 1.04
60 Mark Grudzielanek 185 283 272 11 5 1.04
61 Jacque Jones 203 313 301 12 4 1.04
62 Placido Polanco 194 311 299 12 4 1.04
63 Ellis Burks 101 152 146 6 0 1.04
64 Corey Koskie 157 256 247 9 3 1.04
65 Ichiro Suzuki 246 364 351 13 2 1.04
66 Aubrey Huff 159 242 234 8 4 1.04
67 Ryan Klesko 187 292 282 10 3 1.04
68 David Bell 120 186 180 6 3 1.04
69 Todd Walker 180 280 271 9 4 1.03
70 Jason Kendall 257 400 387 13 2 1.03
71 Eric Young 190 285 277 8 6 1.03
72 Shea Hillenbrand 135 208 202 6 2 1.03
73 Hideki Matsui 107 173 168 5 3 1.03
74 Bobby Higginson 181 274 267 7 3 1.03
75 Carlos Lee 199 318 310 8 2 1.03
76 J.D. Drew 153 244 238 6 5 1.03
77 Adam Kennedy 185 286 279 7 2 1.03
78 Miguel Tejada 206 331 323 8 8 1.03
79 Troy Glaus 115 180 176 4 2 1.02
80 Fernando Vina 171 256 250 6 3 1.02
81 Ivan Rodriguez 152 230 225 5 2 1.02
82 Michael Tucker 139 217 212 5 3 1.02
83 Roger Cedeno 125 189 185 4 6 1.02
84 Edgardo Alfonzo 189 289 283 6 3 1.02
85 Derrek Lee 172 261 256 5 3 1.02
86 Gary Sheffield 204 319 313 6 3 1.02
87 Jeff Conine 161 243 239 4 7 1.02
88 Bernie Williams 215 334 329 5 1 1.01
89 D'Angelo Jimenez 157 231 228 3 5 1.01
90 Jim Edmonds 196 289 286 3 6 1.01
91 Desi Relaford 137 206 204 2 3 1.01
92 Omar Vizquel 205 313 310 3 4 1.01
93 Trot Nixon 148 213 212 1 4 1.01
94 Magglio Ordonez 156 237 235 2 5 1.01
95 Brad Wilkerson 130 191 190 1 4 1.01
96 Milton Bradley 107 165 164 1 3 1.00
97 Vladimir Guerrero 151 234 233 1 5 1.00
98 Barry Bonds 241 351 350 1 2 1.00
99 Rondell White 129 194 194 0 7 1.00
100 Aramis Ramirez 123 185 185 0 1 1.00
101 Bret Boone 172 262 262 0 6 1.00
102 Jose Guillen 101 154 155 -1 5 1.00
103 Shawn Green 207 309 310 -1 5 1.00
104 Jose Vidro 197 298 299 -1 6 1.00
105 Cliff Floyd 156 239 240 -1 1 0.99
106 Julio Lugo 197 301 303 -2 5 0.99
107 Mark Kotsay 196 292 294 -2 5 0.99
108 Jeromy Burnitz 160 242 244 -2 4 0.99
109 Mike Lamb 111 164 165 -1 1 0.99
110 Ricky Gutierrez 104 148 149 -1 3 0.99
111 Scott Hatteberg 127 179 181 -2 3 0.99
112 Craig Biggio 241 357 360 -3 5 0.99
113 Tim Salmon 162 243 246 -3 1 0.99
114 Erubiel Durazo 117 169 171 -2 1 0.99
115 Matt Lawton 209 311 315 -4 8 0.99
116 Bobby Abreu 210 314 319 -5 10 0.99
117 Nomar Garciaparra 171 257 262 -5 1 0.98
118 Deivi Cruz 121 181 186 -5 3 0.98
119 Mark McLemore 129 188 193 -5 4 0.97
120 Jermaine Dye 156 232 239 -7 5 0.97
121 Mark Loretta 199 285 294 -9 5 0.97
122 Mike Sweeney 212 308 318 -10 4 0.97
123 Shannon Stewart 246 345 357 -12 4 0.97
124 Ramon Hernandez 128 185 191 -6 2 0.97
125 Jeff Kent 193 283 294 -11 7 0.96
126 Pat Burrell 154 224 233 -9 4 0.96
127 Sean Casey 186 269 280 -11 5 0.96
128 Garret Anderson 203 298 311 -13 0 0.96
129 Scott Spiezio 186 271 283 -12 6 0.96
130 Jose Hernandez 110 158 165 -7 4 0.96
131 Lance Berkman 243 344 359 -15 8 0.96
132 Brad Ausmus 145 210 220 -10 4 0.96
133 Richard Hidalgo 149 210 220 -10 3 0.95
134 Moises Alou 146 212 223 -11 4 0.95
135 Todd Zeile 149 209 220 -11 2 0.95
136 Brent Mayne 106 148 156 -8 2 0.95
137 Paul Konerko 182 261 275 -14 4 0.95
138 Sammy Sosa 203 289 305 -16 4 0.95
139 Paul LoDuca 112 161 170 -9 4 0.95
140 Vinny Castilla 145 207 220 -13 7 0.94
141 Luis Gonzalez 222 320 340 -20 6 0.94
142 Tino Martinez 171 242 257 -15 3 0.94
143 Alex Gonzalez 123 172 183 -11 6 0.94
144 Jason Giambi 165 236 252 -16 4 0.94
145 Jim Thome 222 312 334 -22 5 0.93
146 Phil Nevin 142 191 205 -14 4 0.93
147 Craig Counsell 141 192 206 -14 9 0.93
148 B.J. Surhoff 152 206 222 -16 7 0.93
149 Adrian Beltre 156 212 229 -17 6 0.93
150 Geoff Jenkins 102 157 170 -13 4 0.93
151 Manny Ramirez 191 270 292 -22 8 0.92
152 Tony Batista 176 247 268 -21 8 0.92
153 Joe Randa 215 302 328 -26 7 0.92
154 Rich Aurilia 132 181 197 -16 5 0.92
155 Mike Lowell 176 249 271 -22 7 0.92
156 Doug Mientkiewicz 150 215 237 -22 7 0.91
157 David Ortiz 150 202 223 -21 4 0.91
158 Dan Wilson 132 172 190 -18 2 0.90
159 Travis Lee 150 202 224 -22 8 0.90
160 Juan Encarnacion 169 228 253 -25 10 0.90
161 Mike Piazza 116 159 177 -18 3 0.90
162 Kevin Millar 127 179 199 -20 3 0.90
163 Ben Grieve 136 186 208 -22 5 0.89
164 Carlos Delgado 237 324 362 -38 8 0.89
165 Jason Varitek 143 200 224 -24 2 0.89
166 Rafael Palmeiro 207 273 307 -34 8 0.89
167 Jorge Posada 139 187 210 -23 4 0.89
168 Edgar Martinez 178 238 269 -31 3 0.89
169 Bill Mueller 191 256 293 -37 10 0.87
170 John Olerud 195 248 285 -37 7 0.87
171 Richie Sexson 151 203 233 -30 7 0.87
172 J.T. Snow 150 202 233 -31 5 0.87
173 Fred McGriff 110 140 161 -21 2 0.87
174 Frank Thomas 121 158 182 -24 5 0.87
175 Mike Lieberthal 130 165 192 -27 4 0.86
176 Dmitri Young 139 185 217 -32 9 0.85
177 Ben Molina 138 177 208 -31 4 0.85
WEST           W  L  PCT  GB  HOME  ROAD  RS  RA   STRK L10
San Diego     50 49 .505 -   29-18 21-31 432 442 Lost 7 3-7
Arizona       48 52 .480 2.5 25-28 23-24 438 526 Won 1  5-5
LA Dodgers    44 54 .449 5.5 23-23 21-31 419 465 Lost 2 4-6
San Francisco 42 55 .433   7 22-30 20-25 431 505 Lost 2 5-5
Colorado      34 63 .351  15 24-23 10-40 419 542 Lost 2 3-7
 J.J. Davis has been something of an enigma. A big guy (6'4" 250), drafted as the 8th overall pick of the Pirates in 1997, who has played at all levels hitting .262 in his minor league career with 112 homeruns in over 2,400 plate appearances. He seemed to have something of a breakthrough season in 2003 hitting 26 homeruns in Nashville. He was then injured for much of 2004 and picked up 26 at bats for the Nats this season and hit 12 homeruns in 51 games for New Orleans while hitting .282. He'll be 27 in October. He also lacks plate discipline and chases breaking balls. He was sent to Colorado Springs where I saw him play for the Sky Sox last night in their double header. He didn't look very good at the plate and has struggled thus far (1 for 16 with 8 ks).
 He was drafted out of Texas as a supplemental pick in the first round by the A's in 2003 and has done nothing but hit thus far posting a career .330 average in 171 professional games. Before this season he was listed as the A's 8th top prospect by Baseball America. He's a line drive hitter with pretty good pop (60 extra base hits last season between A and AA) although he's very aggressive and therefore walked only 47 times in 600 at bats. He's also only an average runner. He does hit left handed which is interesting. In the field he's got soft hands but only average quickness and arm strength which means that the Rockies are probably looking at him as a second baseman. That would be welcome given that Aaron Miles now occupies the spot.
 RUNS  ----- LINEUP ----
 4.143  1 3 2 5 4 6 7 9 8
 4.142  1 3 2 5 4 6 8 7 9
 4.142  1 3 4 2 5 6 7 9 8
 4.142  1 3 4 5 2 6 7 9 8
 4.140  1 3 4 2 5 6 8 7 9
 4.140  1 3 4 5 2 6 8 7 9
 4.139  1 3 2 5 4 6 7 8 9
 4.138  1 2 4 3 5 6 8 7 9
 4.138  1 2 5 3 4 6 8 7 9
 4.138  1 3 4 5 6 2 7 9 8
 RUNS  ----- LINEUP ----
 4.488  5 2 4 3 1 6 7 8 9
 4.488  5 2 4 3 1 7 6 8 9
 4.487  5 2 4 3 1 6 8 7 9
 4.486  1 2 4 3 5 7 6 8 9
 4.486  5 1 4 3 6 2 7 8 9
 4.485  1 2 4 3 5 6 7 8 9
 4.485  1 2 4 3 5 6 8 7 9
 4.485  5 1 4 3 2 7 6 8 9
 4.485  5 1 4 3 6 2 8 7 9
 4.485  5 1 4 3 6 7 2 8 9
                        Round 1                 Round 2         TOTAL
                             HS COLLEGE      HS      HS COLLEGE      HS COLLEGE      HS   TOTAL
    1996Overall TOTAL         22      13     63%      19      11      41      24     63%      65
                MLB           13      10     57%       8       4      21      14     60%      35
                             59%     77%             42%     36%     51%     58%             54%
        PitchersTOTAL         15       8     65%       9       6      24      14     63%      38
                MLB            9       8     53%       3       2      12      10     55%      22
                             60%    100%             33%     33%     50%     71%             58%
        Hitters TOTAL          7       5     58%      10       5      17      10     63%      27
                MLB            4       2     67%       5       2       9       4     69%      13
                             57%     40%             50%     40%     53%     40%             48%

    1997Overall TOTAL         27      25     52%      22      10      49      35     58%      84
                MLB           11      17     39%      12       6      23      23     50%      46
                             41%     68%             55%     60%     47%     66%             55%
        PitchersTOTAL         13      12     52%      13       6      26      18     59%      44
                MLB            2      10     17%       6       6       8      16     33%      24
                             15%     83%             46%    100%     31%     89%             55%
        Hitters TOTAL         14      13     52%       9       4      23      17     58%      40
                MLB            9       7     56%       6       0      15       7     68%      22
                             64%     54%             67%      0%     65%     41%             55%

    1998Overall TOTAL         20      23     47%      16      14      36      37     49%      73
                MLB            9      18     33%       6       7      15      25     38%      40
                             45%     78%             38%     50%     42%     68%             55%
        PitchersTOTAL          9      11     45%      11       6      20      17     54%      37
                MLB            6       8     43%       4       4      10      12     45%      22
                             67%     73%             36%     67%     50%     71%             59%
        Hitters TOTAL         11      12     48%       5       8      16      20     44%      36
                MLB            3      10     23%       2       3       5      13     28%      18
                             27%     83%             40%     38%     31%     65%             50%

    1999Overall TOTAL         25      26     49%      18      15      43      41     51%      84
                MLB            4      14     22%       3       7       7      21     25%      28
                             16%     54%             17%     47%     16%     51%             33%
        PitchersTOTAL         14      22     39%       5      10      19      32     37%      51
                MLB            4      11     27%       0       4       4      15     21%      19
                             29%     50%              0%     40%     21%     47%             37%
        Hitters TOTAL         11       4     73%      13       5      24       9     73%      33
                MLB            0       3      0%       3       3       3       6     33%       9
                              0%     75%             23%     60%     13%     67%             27%

    2000Overall TOTAL         25      15     63%      15      15      40      30     57%      70
                MLB            4       8     33%       2       9       6      17     26%      23
                             16%     53%             13%     60%     15%     57%             33%
        PitchersTOTAL         13      10     57%      10       6      23      16     59%      39
                MLB            1       6               1       4       2      10     17%      12
                              8%     60%             10%     67%      9%     63%             31%
        Hitters TOTAL         12       5     71%       5       9      17      14     55%      31
                MLB            3       2     60%       1       5       4       7     36%      11
                             25%     40%             20%     56%     24%     50%             35%

    2001Overall TOTAL         18      26     41%      17      14      35      40     47%      75
                MLB            4      11     27%       2       6       6      17     26%      23
                             22%     42%             12%     43%     17%     43%             31%
        PitchersTOTAL          8      13     38%      10       9      18      22     45%      40
                MLB            2       5     29%       1       5       3      10     23%      13
                             25%     38%             10%     56%     17%     45%             33%
        Hitters TOTAL         10      13     43%       7       5      17      18     49%      35
                MLB            2       6     25%       1       1       3       7     30%      10
                             20%     46%             14%     20%     18%     39%             29%

    2002Overall TOTAL         18      23     44%      20      10      38      33     54%      71
                MLB            3       7     30%       0       4       3      11     21%      14
                             17%     30%              0%     40%      8%     33%             20%
        PitchersTOTAL          7      14     33%       9       4      16      18     47%      34
                MLB            2       4     33%       0       2       2       6     25%       8
                             29%     29%              0%     50%     13%     33%             24%
        Hitters TOTAL         11       9     55%      11       6      22      15     59%      37
                MLB            1       3     25%       0       2       1       5     17%       6
                              9%     33%              0%     33%      5%     33%             16%

        Overall TOTAL        155     151     51%     127      89     282     240     54%     522
                MLB           48      85     36%      33      43      81     128     39%     209
                             31%     56%             26%     48%     29%     53%             40%
        PitchersTOTAL         76      61     55%      60      42     136     103     57%     239
                MLB           22      33     40%      18      16      40      49     45%      89
                             29%     54%             30%     38%     29%     48%             37%
        Hitters TOTAL         79      90     47%      67      47     146     137     52%     283
                MLB           26      52     33%      15      27      41      79     34%     120
                             33%     58%             22%     57%     28%     58%             42%
 1-2999        AB       H     2B    3B     HR  BAVG   SLG   BPS
Not RISP  1748765  414965  70688  9459  35513  .237  .349  .587
RISP       588724  135614  23479  3614  10466  .230  .336  .566

 >=3000        AB       H     2B    3B     HR  BAVG   SLG   BPS
Not RISP  2848124  773189 135086 19045  84334  .271  .421  .693
RISP       974948  257380  45517  7173  26300  .264  .406  .670
"When we assess the goodness of fit of a model, there are two possible conclusions: either there is significant evidence to reject the model or there is insufficient evidence. Saying there is not enough evidence to reject the model doesn’t say the model is true, but it does say that we just can’t provide evidence to say that it is false. Statisticians don’t prove models are true – that’s why we are careful to say things like "we have insufficient evidence to reject a model.'"
His opinion, then, is that phenomena like those mentioned by James including clutch hitting may indeed exist, but it is likely they have a very small effect and are difficult to pick up with a statistical test.
Birnbaum's Regressions
The more controversial of the two articles in By The Numbers is Phil Birnbaum's "Clutch Hitting and the Cramer Test". In this article Birnbaum attacks James' notion that "random data proves nothing - and it cannot be used as proof of nothingness" and says it is "certainly false". His position is that if one can show that their study is well designed, then a conclusion of "no effect" can reasonably be offerred.
Birnbaum goes on to apply the method used in Cramer's 1977 article to data from 14 pairs of seasons from 1974 through 1990 and shows the correlations in the table reproduced here.
         r     r^2   f
74-75  .0155 .0002 .86
75-76  .0740 .0055 .37
76-77  .0712 .0051 .40
77-78  .0629 .0040 .44
78-79 -.1840 .0339 .02
79-80  .0038 .0000 .96
82-83 -.0250 .0006 .75
83-84  .0456 .0021 .60
84-85  .0222 .0005 .79
85-86  .0728 .0053 .38
86-87  .0189 .0004 .82
87-88  .0034 .0000 .97
88-89  .0829 .0069 .33
89-90  .0373 .0014 .67
He then creates a model where clutch hitting exists and compares the model's results with the actual results. His conclusion is that while the Cramer test can easily determine whether clutch hitting is a real phenomenon if the ability were normally distributed with a standard deviation of 30 points, the method starts to fail once the standard deviation falls below about 7.5 points. In other words, he is in agreement with Albert that if clutch hitting is real, its effect is small.
He then combines the data for his 14 seasons into a single regression and concludes that the Cramer test could pick up the effect at a standard deviation of 15 points but begins to fail at a standard deviation of about 10 points.
In his set of conclusions Birnbaum acknowledges that the Cramer test cannot completely disprove the existence of clutch hitting, but it does put a "strong lower bound on the magnitude of the possible effect". That lower bound is that the effect is certainly less than 15 points of batting average; "that is, at least two-thirds of all players are expected to clutch hit within .015 of their non-clutch batting average." And so his conclusion is that given the small effect it is probably impossible to distinguish good clutch hitters from bad.
Two Responses
These article then generated a response from Bill James called "Mapping the Fog" which he posted to the SABR Statistical Analysis Committee Yahoo group. That was quickly followed up by a response from Phil Birnbaum published in the same forum. Both responses have now been published along with a lively discussion by Chris Dial on The Baseball Think Factory.
In the meat of his response James creates a model where clutch hitting exists (a model league where 20% of the hitters are clutch performers at the level of 25 points) and then uses the Cramer test to try and detect the effect. The test does not reliably detect it (it would do so only 65% of the time) and so he concludes that even under these ideal circumstances the Cramer test has nothing to say as to whether clutch hitting is a real phenomena or not.
"Even when we know that the clutch effect does exist within the data, even when we give that effect an unreasonably clear chance to manifest itself, there is still a 35% chance that it will entirely disappear under this type of scrutiny."
James goes on to respond specifically to statements made in both articles and notes that in his opinion "there is an immense amount of work to be done before we really begin to understand this issue."
In his response Birnbaum response is critical of the way James applied the Cramer test to his model, using a simpler sign based test rather than an actual regression. He goes farther, however, and actually uses James' model with the regression analysis and concludes that using 14 separate seasons of data the Cramer test works in that it would pick up clutch hitting using James' model.
My Response
I find this entire discussion important and fascinating since it comes so close to the heart of how many sabermetric studies have been done - the most recent and famous being the conclusions drawn in favor of DIPS.
For the most part I have to side with Albert and Birnbaum and agree that while these statistical tests can never prove that clutch hitting or platoon differentials do not exist, using data over a number of seasons (after all, the number of true clutch plate appearances is small, around 50 per 600) or for an entire career they can surely indicate that if they exist, their effects are small and may even fall within the normal variation of the statistics that are used to measure them. As a result - and here is the actionable thing - they needn't be considered when making personnel decisions over the long haul.
As an aside I thought the most interesting comment made in the discussion of this topic on TBTF was that it could be the case that clutch hitting is actually a "negative ability". In other words, it could be the case that most hitters actually perform worse in clutch situations and that good clutch hitters can be defined as those who maintain their performance level. It would be interesting to see what a model would look like to test for this.