
First, just wanted to say thanks for all the feedback on my article on umpiring in the post season over at THT.
One reader noted that:
"...your listing of blown calls this post-season omitted a crucial call from this year's World Series: Jermaine Dye's walk in Game 2, which turned out to be a foul ball (which even Dye, to his credit, admitted after the game). Can't say what would have happened if Dye's swing had been correctly called foul. But we do know that the ball 4 led to reliever Dan Wheeler being taken out of the game, and the new reliever, Chad Qualls, gave up a grand slam HR on the next pitch (to Konerko)."
And of course the reader is absolutely correct, however, I have a small excuse. The article was written prior to game 2 but wasn't run until today due to scheduling. I should have updated it to reflect this play since it was clearly another blown call and one that had a potentially huge impact on the game and the series.
Another reader makes a case that the 1969 series had an even more egrarious call than the one I mentioned - the game 5 reversal of the ball call on Cleon Jones to a hit by pitch after the Mets disputed it. Jones went on to score on a Don Clendenon home run and the Mets won the game 5-3 and the series. The difference on this call is that to me it wasn't clearly blown since the Mets had some evidence (the shoe polish) to back up their claim. The reader would argue, however, that the practice of huddling and reversing a call was not standard for the time and so the call should not have been reversed.
This is also an example of the main point of the article since two Baltimore errors in the 8th along with a Ron Swoboda double are what plated the final two runs for the Mets. Everybody remembers the hit by pitch but not the errors.
Monday, October 31, 2005
More But for This...
Relying on the Homerun
Here's a quick question. Which teams relied most on the homerun in 2005?
One way to answer that is to rank the teams by the percentage of their runs that scored on homeruns. Here they are:
Team          RS   RS-HR     Pct
TEX          865     413   47.7%
CIN          820     364   44.4%
NYA          886     390   44.0%
CHA          741     314   42.4%
CHN          703     296   42.1%
ARI          696     288   41.4%
CLE          790     321   40.6%
BAL          729     293   40.2%
ATL          769     300   39.0%
BOS          910     348   38.2%
MIL          726     275   37.9%
NYN          722     269   37.3%
HOU          693     257   37.1%
DET          723     262   36.2%
PHI          807     290   35.9%
TBA          750     262   34.9%
LAN          685     238   34.7%
SLN          805     275   34.2%
COL          739     246   33.3%
SFN          649     213   32.8%
OAK          772     252   32.6%
MIN          688     219   31.8%
ANA          761     240   31.5%
PIT          680     211   31.0%
TOR          775     238   30.7%
SEA          699     212   30.3%
SDN          684     206   30.1%
FLO          717     215   30.0%
KCA          701     200   28.5%
WAS          639     166   26.0%
Texas leads both in percentage of runs scored on homeruns and total runs scored on homeruns while the playoff teams come in 3rd (Yankees), 4th (White Sox), 9th (Atlanta), 10th (Boston), 13th (Astros), 18th (Cardinals), 23rd (Angels), and 27th (Padres).
Sunday, October 30, 2005
One Step Forward, One Step Back
In the world of sabermetric-minded general managers, this weekend saw one step forward and one step backwards. First, the Arizona Diamondbacks have hired former Red Sox assistant GM Josh Byrnes replacing Joe Gariagiola Jr. who took a job with Major League Baseball. Byrnes got a four year contract with a club option for a 5th. Byrnes was the assistant GM here in Colorado for two years before going to Boston. Speaking of Boston, GM Theo Epstein is still in contract negotiations, and it appears he's being a tough negotiator.
While Byrnes is considered by many to be more of a Moneyball type he also has a reputation for being somewhat of a moderate. That was the step forward. Interestingly, Will Carroll noted on BP Radio on Saturday that the GM position in Arizona may have scared some potential candidates away since it appears that Matt Williams may be a sort of "GM in waiting" and has the ear of owner Jeff Morad. It'll be interesting to see what kind of patience Morad and his partner show with the young Byrnes and how much impact Byrnes will be able to have given that the D'Backs are still saddled with some large contracts, namely $11.5M to Luis Gonzales and $11M to Javier Vazquez and of course Troy Glaus ($9M) and Russ Ortiz ($7.4M). The story in the Arizona Republic noted that the owners recognize they're not baseball men and so Byrnes will be given the autonomy to make the decisions. It'll be an interesting situation to watch.
The step back came on Saturday when Paul DePodesta, the Dodgers GM who was hired before the 2004 season was fired. The way the story's being played in the mainstream media is that DePodesta is a poor communicator and neglected team chemistry, which led to the Dodgers 71-91 record this season after winning the NL West in 2004. The chemistry angle comes from the trade of fan favorite Paul LoDuca and the acquisitions of Jeff Kent, Milton Bradley, and J.D. Drew, all of whom are not exactly Shawon Dunston in the clubhouse.
While John Wesiman over at Dodger Thoughts will provide much better commentary over the next few days, my initial reaction is that essentially one year is too little by which to evaluate a GM unless they absolutely prove inept. After all, DePodesta has never even hired a manager let alone had time for draft picks during his tenure to help the club. It seems as if Frank McCourt is a guy who is quick to change directions when things don't work out immediately and probably hired DePodesta not because he understood the philosophy of "be the house" but rather because it was viewed as the hot new thing. McCourt's management style having now fired two GMs in 22 months doesn't bode well for the Dodgers franchise in the years to come. One could see him swinging between one extreme and the other in the same way as when Martin Luther compared human nature to a drunkard trying to ride a horse. He gets on and falls off on the left side. He resolves not to make that mistake again, so he remounts, careful to avoid falling off on the left, and promptly falls off on the right.
And it looks like McCourt will be leaning the other way in considering a longtime baseball guy like Pat Gillick, a man who has openly criticized the Moneyball approach as I noted in my article on the book Scout's Honor.
Saturday, October 29, 2005
Angus on Baserunning
Jeff Angus, author of the Management by Baseball weblog has written a nice piece on baserunning over at Baseball Analysts where he mentions my work on baserunning. Thanks Jeff.
In that article he notes that he's using data that goes through August. I now have run my framework for 2005, complete results from which will be published in the 2006 Hardball Times Annual (order yours today), and here are the top 10 baserunners listed by opportunities. Keep in mind that these opportunities consist of those where the runner was on first with second empty and the batter singles, the runner is no first with second empty and the batter doubles, and when the runner is on second with third empty and the batter singles.
These numbers are also park and situation adjusted and the columns mean:
- Bases - the number of bases gained in these situations. This number differs from what Angus showed since he calculates a "safe %" indicating how often the runner took the extra base
- OA - the number of times the runner was out advancing the extra base
- IB – the difference between the actual and expected bases gained. Negative values indicate that the base runner did not advance as many bases as an average player would have given the same opportunities
- Base Runner Runs or BRR – the total number of runs a runner can be attributed given his base running performance in the opportunities he had (given our three scenarios above)
- Incremental Runs or IR – the difference between the BRR and the expected number of runs. Negative values indicate that the runner performed poorly in his opportunities by not taking as many bases and therefore contributing fewer runs than he should have
- Incremental Run Percentage (IRP) – a rate statistic calculated as the ratio of IR to BRR. IRP is akin to OPS+ in that it shows at what rate players contribute runs with their base running. Values over 1 indicate players who contributed above what would have been expected while values under 1 indicate a poor performance. IRP is needed for player comparisons since IR, like RBIs, is weighted by opportunity.
Drum roll please....
Team    Name             Opp Bases OA    IB   BRR    IR  IRP
NYA     Derek Jeter       69   105  3   4.4  7.99  0.99  114
BOS     Johnny Damon      66   100  2  -1.4 10.38 -0.24   98
BAL     Miguel Tejada     65    99  1   3.1 10.47  0.35  103
SLN     David Eckstein    64    95  1   1.9  7.58  0.42  106
PHI     Jimmy Rollins     63    96  2   3.8  7.04 -0.25   97
SEA     Ichiro Suzuki     63    99  1   5.3  9.26  1.56  120
CHN     Jeromy Burnitz    61    83  2  -2.7  6.97 -0.51   93
ANA     Darin Erstad      59    95  0   9.0 11.14  3.05  138
BAL     Brian Roberts     59    83  1  -1.8  8.09 -0.63   93
CHN     Derrek Lee        59    91  1   3.0  9.79  1.16  113
From this you can see that even though Johnny Damon may have taken the extra base upwards of 60% of the time, when considered in his context complete with David Ortiz and Manny Ramirez as hitters coming behind, he actually contributed negative .24 runs and was 2% below average. On the other hand Darin Erstad of those Angels contributed an additional 3 runs with his baserunning and was 38% above average, which incidentally was just slightly more than Chone Figgins contributed (3.02).
Friday, October 28, 2005
Bernanke on Baseball
Just found out courtesy of the SABR-L list that Bush's nominee to head the Federal Reserve Board, Ben Bernanke, is a baseball fan. There was a short discussion on NPR of Bernake's view on ERA on "All Things Considered".
Bernanke's view is that ERA is not a "fair" measure by which to gauge relief pitchers. In the NPR piece Dwight Jaffee, the Willis Booth Professor of Banking Finance and Real Estate at the Haas School of Business at the University of California at Berkeley discusses how he an Bernanke came to this realization but never really developed anything better.
Of course this realization has occurred to many people over the years and a few of the ways to correct for it I mention here. Our Fielding Independant Pitching (FIP) statistic on THT is another way to correct for it.
Bernanke's interest in baseball was also discussed in the October 26th New York Times.
"Perhaps the best way to establish transparency, Mr. Bernanke has written, is to set up an easily understandable process. It is in many ways the opposite of the image that Mr. Greenspan has helped cultivate, that of an oracle.
He will probably work toward depersonalizing monetary policy,' Mr. Gertler said.
A useful analogy is to Bill James, the baseball writer whose books Mr. Bernanke has discussed with fellow economists. Mr. James's work, which often argues for statistical analysis over intuition, 'was always a topic of conversation,' Mr. Gertler said.
He remembers Mr. Bernanke's being especially interested in finding statistics that forecast future performance. In the same vein, he has argued that central bankers should rely as much as possible on the enormous amounts of economic data now available and less on hunches.
The hope eventually is to come up with a statistical formula that processes this information and gets the best forecast,' said Jean Boivin, a Columbia economist who has done research with Mr. Bernanke. 'Once you do that, the question is how much is left over for judgment.'"
Wednesday, October 26, 2005
Chone Figgins and the Defensive Spectrum
In my most recent article on THT I wrote about the shift in the defensive spectrum that occurred in the 1940s that resulted in third base moving left on the spectrum while second base moved right.
In my brief analysis I noted that the prevalence of bunting and chop hitting in the first part of the century was likely responsible for third base being considered the more demanding defensive position. Dave Studeman, who knows alot of cool stuff, pointed out to me that Bill James had written on this subject in his book Win Shares in an article titled "Why Did the Defensive Spectrum Jump?". I have the book and have read it but my fast aging mind seems to have forgotten that article. Tonight I took my copy off the shelf and re-read the article.
He notes the same trend I show in the graph as to the offensive production of second base versus third base in the decades from 1900 through 1969 using Runs Created and shows the shift occurring sometime in the 1930s. My graph shows the same trend and its clear by the mid 1930s that third baseman had overtaken second sackers.
However, James does not attribute the shift in the spectrum to bunting and chop hitting but rather to the dual factors of increasing double plays and decreasing errors. Since 1947 there have been more double plays in the majors each year (except 1963 and 1975) than errors. His reasoning is that as double plays became more common managers were more willing to sacrifice offense in order to get double plays. At the same time as errors became less frequent managers were willing to put lesser defensive players at third base since the cost wasn't as high.
That makes perfect sense to me and so I certainly don't disagree. But I still think that bunting and chop hitting probably had an impact, although lesser, as well.
Interestingly, he notes how this trend is detectable in the common language we use to describe the positions. In the early part of the century second baseman were referred to as "keystone men" whereas today they are referred to as "pivot men" emphasizing their ability to turn two.
Air Force Taboo
Well, here in Colorado Springs Air Force coach Fisher DeBerry apologized today for the comments he made after his team's 48-10 loss to TCU over the weekend. In those comments he noted that TCU
"had a lot more Afro-American players than we did and they ran a lot faster than we did. It just seems to me to be that way. Afro-American kids can run very well. That doesn't mean that Caucasian kids and other descents can't run, but it's very obvious to me that they run extremely well."
He also on Monday told The Gazette of Colorado Springs that "you don't see many minority athletes in our program", implying that the academy needed to recruit more minorities.
For those that have read my review of the book Taboo you'll not be surprised that I agree with DeBerry's comments in general. Now I have no specific knowledge of the TCU or Air Force athletes, but as a general principal there is no doubt that at the elite level athletes of west African descent dominate in sports where speed and jumping ability confer an advantage. Football, at some positions, fits the mold and so it would in fact be surprising if blacks weren't overly represented. It also wouldn't surprise me that if a team with 85% African Americans (who are primarily of west African descent) as compared to a team with 15% African Americans wouldn't dominate the top positions when both teams are ranked from fastest to slowest.
So then why was DeBerry forced to apologize? For the simple reason that physical group differences are a taboo subject because of their link to possible mental group differences. That's why, rather than the stated reason that it was a violation of the academy's racial and ethnic anti-discrimination policy, Athletic director Hans Mueh found himself saying:
"What we're talking about is speed. There's speed that cuts across black, white, gray, blue, whatever. It was just an inappropriate comment and you all know it was an inappropriate comment."
The first part of his comment is simply and demonstrably not true. The second part reflects the politically correct orthodoxy.
The simple fact is that DeBerry's comments weren't disciminatory. Discrimination occurs when an individual is treated differently (usually badly) only because of their race and not based on their talents. Acknowledging that there are group differences in no way discriminates against anybody because it has nothing to say about any individual.
Streaky Chat
Just saw that Alan Reifman has posted a chat with Jim Albert and Jay Bennett on his Hot Hand in Sports site. Albert and Bennett of course are the authors of the excellent book Curve Ball: Baseball, Statistics, and the Role of Chance in the Game.
I thought that their answer to the question of why there is more luck in baseball was interesting. Their three main reasons were:
"(1) The major sports allow the best team to be fielded in each game. Because pitchers can only start once every four or five days, the most important player in baseball varies from game to game. This tends to equalize teams in a baseball game. How would the Patriots do if Tom Brady played in only one quarter of the games? It would tend to bring them back in the pack.
(2) Most major sports allow unlimited use of their best players. In football, if you have Jim Brown or Walter Payton, your use of his exceptional playing ability is limited only by defensive adjustments (which also helps to make the rest of your offense look better). In basketball, you can give the ball to Michael Jordan or Allen Iverson as much as you want. Baseball limits the use of your best players in the lineup. You can't allow Barry Bonds to bat any time you want. The use of an advantage in ability is severely limited in baseball. I think this is the primary reason for your example about the 49ers vs. the Patriots at Foxboro and the Devil Rays sweeping the Yankees.
(3) Baseball has a longer season than all other major sports. It's more likely to achieve extremely high or low winning percentages with a shorter season. This is especially true for football, less so for basketball and hockey."
To these I would simply add that in baseball a single event such as the swing of the bat can more often alter the score and therefore make the difference between winning and losing whereas in sports such as basketball and baseball it usually takes a combination of skillfully executed plays to result in a score. When that is the case a less skilled player can have a disproportionate affect on the game.
Grand Slams and Game Enders
I've had some folks ask me who was the last player to hit a grand slam in the World Series after Paul Konerko's game 2 blast. Luckily, the guy who keeps track of everything related to homeruns, SABR's David Vincent published a list on SABR-L this week complete with the inning. And for good measure he threw in the walk-off homeuns as well.
World Series Game-Enders


10/05/1949 Tommy Henrich       NYA AL  9
09/29/1954 Dusty Rhodes        NY  NL 10
10/06/1957 Eddie Mathews       MIL NL 10
10/13/1960 Bill Mazeroski      PIT NL  9
10/10/1964 Mickey Mantle       NYA AL  9
10/21/1975 Carlton Fisk        BOS AL 12
10/15/1988 Kirk Gibson         LAN NL  9
10/18/1988 Mark McGwire        OAK AL  9
10/26/1991 Kirby Puckett       MIN AL 11
10/23/1993 Joe Carter          TOR AL  9
10/26/1999 Chad Curtis         NYA AL 10
10/31/2001 Derek Jeter         NYA AL 10
10/22/2003 Alex Gonzalez       FLO NL 12
10/23/2005 Scott Podsednik     CHA AL  9


Grand Slams

Elmer Smith         CLE AL 10/10/1920   1
Tony Lazzeri        NYA AL 10/02/1936   3
Gil McDougald       NYA AL 10/09/1951   3
Mickey Mantle       NYA AL 10/04/1953   3
Yogi Berra          NYA AL 10/05/1956   2
Bill Skowron        NYA AL 10/10/1956   7
Bobby Richardson    NYA AL 10/08/1960   1
Chuck Hiller        SFN NL 10/08/1962   7
Ken Boyer           SLN NL 10/11/1964   6
Joe Pepitone        NYA AL 10/14/1964   8
Jim Northrup        DET AL 10/09/1968   3
Dave McNally        BAL AL 10/13/1970   6
Dan Gladden         MIN AL 10/17/1987   4
Kent Hrbek          MIN AL 10/24/1987   6
Jose Canseco        OAK AL 10/15/1988   2
Lonnie Smith        ATL NL 10/22/1992   5
Tino Martinez       NYA AL 10/17/1998   7
Paul Konerko        CHA AL 10/23/2005   7
Tuesday, October 25, 2005
The Birth Pangs?
Last weekend we visited a church in Colorado Springs where the pastor was in the midst of preaching a series on the book of Revelation. Personally, I feel that there is so much mystery, symbolism, and ambiguity in the book, that the topic is better left alone from the pulpit unless it is to educate on the various eschatological positions out there. Be that as it may I always enjoy listening to a sermon on the topic.
In this case it became immediately clear (although he didn't make it explicitly so) that the pastor was preaching from a dispensational premilennialist and pre-tribulation position - that is - the position that there will be a "rapture" of Christians before a tribulation period in which the antichrist is revealed and conquered followed by a literal 1,000 year reign of Christ on earth and culminating in the final judgment. This view also takes literally many of the scenes painted in the book of Revelation including the "mark of the Beast" and the 144,000 witnesses. This view was popularized in the 1830s and is the dominant view of the evangelical community as evidenced by the popularity of the Left Behind series of books by Tim LaHaye and Jerry Jenkins.
He used as his text Revelation 6 which discusses the opening of the seven seals by the angel. What I found interesting was that he used the Olivet Discourse in Matthew 24, specifically verses 4-14, as general signs of the coming of the rapture and hence the tribulation. In that passage Jesus' disciples ask him what will be the signs of his second coming.
And Jesus answered and said to them, "See to it that no one misleads you. For many will come in My name, saying, 'I am the Christ,' and will mislead many. You will be hearing of wars and rumors of wars. See that you are not frightened, for those things must take place, but that is not yet the end. For nation will rise against nation, and kingdom against kingdom, and in various places there will be famines and earthquakes. But all these things are merely the beginning of birth pangs." (Matt. 24:4-8)
The pastor then specifically focused on the "birth pangs" phrase and went on to provide evidence that we're fast approaching the beginning of that time in history with the expected and welcome call to repentance.
His "evidence" was in the form of increased earthquake activity and the increase in natural disasters in general. He put on the overhead a chart that looked as follows:
Magnitude 6+ Quakes
1900-1909   3
1910-1919   2
1920-1929   2
1930-1939   5
1940-1949   4
1950-1959   9
1960-1969  13
1970-1979  51
1980-1990  86
1991-1996 100
There was no source noted nor did he explain where these numbers came from.
Unfortunately, for the pastor this view that seismic activity is on the increase isn't really supported by good data. Back in 1999 the Christian young-earth creationist group ICR published an article on what they called this Christian "urban legend" and showed using data from 1900-1999 that large magnitude earthquakes are actually on the decline overall and that earthquakes tend to follow a periodic trend as shown in their graph below:
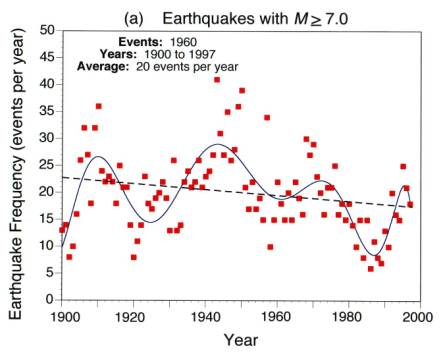
Since 1999 the trend hasn't changed and following table was published by the US Geological Survey in response to a question as to why we're having so many earthquakes.
 Magnitude      2000    2001    2002    2003    2004    2005

 8.0 to 9.9        1       1       0       1       2       1
 7.0 to 7.9       14      15      13      14      14       9
 6.0 to 6.9      158     126     130     140     140     121
 5.0 to 5.9     1345    1243    1218    1203    1509    1429
 4.0 to 4.9     8045    8084    8584    8462   10894   11085
 3.0 to 3.9     4784    6151    7005    7624    7937    6282
 2.0 to 2.9     3758    4162    6419    7727    6317    3483
 1.0 to 1.9     1026     944    1137    2506    1344      21
 0.1 to 0.9        5       1      10     134     103       0


No Magnitude    3120    2938    2937    3608    2939     679


      Total    22256   23534   27454   31419* 31199 * 23110
In answer to the question the USGS also noted that...
"Although it may seem that we are having more earthquakes, earthquakes of magnitude 7.0 or greater have remained fairly constant throughout this century and, according to our records, have actually seemed to decrease in recent years. A partial explanation may lie in the fact that in the last twenty years, we have definitely had an increase in the number of earthquakes we have been able to locate each year. This is because of the tremendous increase in the number of seismograph stations in the world and the many improvements in global communications. In 1931, there were about 350 stations operating in the world; today, there are more that 4,000 stations and the data now comes in rapidly from these stations by telex, computer and satellite. This increase in the number of stations and the more timely receipt of data has allowed us and other seismological centers to locate many small earthquakes which were undetected in earlier years, and we are able to locate earthquakes more rapidly."
So the perception that there are more earthquakes in these "last days" is just that - a perception - based on the fact that increasing technology allows for better detection and quicker reporting of the quakes that do occur. It is likely that the pastor got his data from either an antiquated or biased source that didn't take these factors into account.
Although I don't have a cool graph to support it, I did hear a report on NPR the other day on the seeming increase in hurricanes in this and recent years. The gist of the answer by the expert they had on was that while this is a big year there have been other years like this in the 20th century such as 1933. The point is that this also is cyclical phenomena as has been reported in the media recently driven by warmer currents in the Atlantic. The most recent cycle started around 1995 and if history is a guide, will last another 10 to 20 years.
In the final analysis I think it was not only a bit presumptuous on the part of the pastor to appear so sure he knows exactly what God has in mind, but also intellectually lazy to present so-called evidence that is easily refuted by 10 minutes of Googling.
Sunday, October 23, 2005
Game 2 Musings
More musings while watching the World Series game two...
Senor Tumbalina
While watching game one I tried a new technique for charting pitches. I was going to use it to compare Roger Clemens and Jose Contreras but since Clemens only went two that didn’t work out so well. Anyway, Contreras went 7 innings and one batter so here’s my summary given the data I collected.
Inning One
Contreras starts off each of the three hitters with fastballs (2 called strikes and a ball) and hits 96 on the gun on his sixth pitch to Craig Biggio on which he grounds out to short. He gets Willy Taveras to pop out to short on his first forkball of the night on pitch 10 and then uses the forkball on the final four pitches to Lance Berkman, the last of which comes in at 78mph and catches Berkman looking.
Inning Summary: 15 pitches, 9 fastballs (93.4mph), 5 forkballs (79.6mph), 1 slider (88mph)
Game Summary: 15 pitches, 9 fastballs (75%), 5 forkballs (33%), 1 slider (6.7%)
Inning Two
Starts each of the four hitters with fastballs and throws just one forkball in the inning, the third pitch to Jeff Bagwell which hit him. Mike Lamb hits a homerun to center on an 0-1 93mph fastball down and in. Fastest pitch is the 95mph fastball to start Bagwell. Seems to be making a conscious effort to pitch Baggy up and in with hard stuff.
Summary: 9 pitches, 8 fastballs (91.9mph), 1 forkball (78mph), 0 sliders (-mph)
Game Summary: 24 pitches, 17 fastballs (75%), 6 forkballs (25%), 1 slider (4.1%)
Inning Three
Longest inning of the game for Conteras as he throws 19 pitches to six hitters. He starts the leadoff hitter Brad Ausmus with a 92mph fastball and then Ausmus singles to right on the next pitch – a 93mph fastball up and out over the plate. He starts Adam Everett with a 92mph fastball and gets him to roll into a force out on an 88mph slider on the fourth pitch. He seems to fall in love with his slider after that and throws it on four of his five pitches to Biggio. He mixes in a forkball at 78mph that Biggio fouls off before singling to center on an 88 mph slider. He also throws it on the first two pitches to Taveras who helps him out by sacrificing the runners to second and third. Berkman follows with a double to right on a handing 78mph forkball on the first pitch and then finally rights the ship and throws three straight fastballs to Morgan Ensberg who grounds to short after starting him with a forkball followed by a slider.
Summary: 19 pitches, 8 fastballs (92.3mph), 3 forkballs (79.7mph), 8 sliders (87mph)
Game Summary: 43 pitches, 25 fastballs (58.1%), 9 forkballs (20.9%), 9 sliders (20.9%)
Inning Four
He seems to have learned his lesson and throws only fastballs and forkballs getting a strikeout of Lamb and flyouts from Bagwell and Lane. The strikeout of Lamb he gets on his third straight forkball (79mph) down and in. To Bagwell he muscles up on the fastball once again throwing fastballs on five of six pitches all at 94 or 95mph. He gets him on a fastball up and in that Bagwell just misses and flies to left. Lane flies to right on a 93mph fastball on the outside corner. Started all three hitters with fastballs.
Summary: 14 pitches, 10 fastballs (93.7mph), 4 forkballs (80mph), 0 sliders (-mph)
Game Summary: 57 pitches, 35 fastballs (61.4%), 13 forkballs (22.8%), 9 sliders (15.9%)
Inning Five
In the 5th Conteras got Ausmus to fly to right on the first pitch, a 92mph fastball. Everett grounded to third on the second pitch which may have been a slider and Biggio grounded to third on the fourth straight fastball he’d seen. The Astros are exhibiting very little patience. Conteras didn’t need to break out the forkball this inning and all hitters are started with fastballs.
Summary: 7 pitches, 6 fastballs (91.7mph), 0 forkballs (-mph), 1 slider (89mph)
Game Summary: 64 pitches, 41 fastballs (64%), 13 forkballs (20.3%), 10 sliders (15.6%)
Inning Six
Taveras leads off the inning with a line drive double to left on a 92mph fastball up and in on the first pitch. Berkman hits an 0-1 pitch to first and advances the runner to third, both pitches fastballs. Ensberg swings at a 1-0 pitch and grounds to third, both pitches fastballs. To Lamb he goes with a first pitch fastball and follows with three forkballs at 80mph each, the last of which Lamb grounds to second. Once again the Astros don’t work the count. All hitters started with fastballs.
Summary: 9 pitches, 6 fastballs (92.8mph), 3 forkballs (80mph), 0 sliders (-mph)
Game Summary: 73 pitches, 47 fastballs (64.4%), 16 forkballs (21.9%), 10 sliders (13.7%)
Inning Seven
Conteras hits the leadoff hitter Bagwell on another forkball up and in after starting him with an 88mph fastball up he took for a called strike. Lane pops to first on a 92mph first pitch fastball. Ausmus is then hit with a first pitch 92mph fastball. Everett continues not to be patient and swings at an 0-1 fastball and grounds into a double play. Biggio then also swings at the first pitch, an 87mph fastball and grounds to third. Astros getting less patient as the game wears on. Four of the five hitters started with fastballs. The fastball has noticeably slowed.
Summary: 7 pitches, 5 fastballs (90.2mph), 1 forkball (79mph), 1 slider (86mph)
Game Summary: 80 pitches, 52 fastballs (65%), 17 forkballs (21.2%), 10 sliders (12.5%)
Inning Eight
Taveras hits another double to left center on a second pitch 85mph slider. He’s relieved in favor of Neal Cotts.
Summary: 2 pitches, 1 fastball (88mph), 0 forkballs (-mph), 1 slider (85mph)
Game Summary: 82 pitches, 53 fastballs (64.7%), 17 forkballs (20.7%), 11 sliders (13.4%)
For the game Conteras started 24 of the 29 hitters with fastballs. Astros hitters offered at the first pitch 11 times but didn’t work the count after the first pitch seeing just 2.83 pitches per plate appearance (Carlos Silva was tops in the majors last season at just over 3). I was surprised he didn’t use the forkball a bit more throwing it about one in five pitches. It’s possible that a few of those 11 sliders weren’t actually sliders but hard forkballs but his forkball was very consistently from 78-80mph. He got 12 groundball outs of his 21.
Saturday, October 22, 2005
Game 1 Musings
Here are my random thoughts on the game one 5-3 victory by the White Sox who are now 8-1 this post season.
Friday, October 21, 2005
The Wild Ones
Ok, so you want to know who is the wildest as well?
Here are the top 20 in balls thrown (not counting intentional) per batter faced.
Name                 PA  Pitches    P/PA       B   B/Pit
Al Leiter            670    2848    4.25    1253   0.440
Jorge De La Rosa     208     887    4.26     382   0.431
Dewon Brazelton      354    1305    3.69     561   0.430
Kirk Rueter          489    1842    3.77     791   0.429
Zach Day             229     859    3.75     365   0.425
Russ Ortiz           551    2069    3.75     860   0.416
Mike Gonzalez        212     864    4.08     357   0.413
JP Howell            328    1283    3.91     530   0.413
Dennys Reyes         215     790    3.67     326   0.413
Luke Hudson          380    1436    3.78     588   0.409
Seth McClung         501    1996    3.98     817   0.409
Wes Obermueller      305    1116    3.66     456   0.409
Chad Harville        203     794    3.91     324   0.408
Jason Jennings       551    1983    3.60     809   0.408
JC Romero            264    1027    3.89     418   0.407
Jaret Wright         302    1118    3.70     455   0.407
Scott Erickson       249     837    3.36     339   0.405
Matt Thornton        262    1109    4.23     449   0.405
Kevin Correia        264    1001    3.79     405   0.405
Wade Miller          414    1673    4.04     675   0.403
Wow, Al Leiter threw alot of balls.
Swing and Miss
As with the previous post here are the pitchers in 2005 who made hitters miss most often.
Name                  PA Pitches    P/PA       S   S/Pit
Brad Lidge           291    1134    3.90     214   0.189
Rudy Seanez          248     993    4.00     180   0.181
Michael Wuertz       319    1323    4.15     211   0.159
Billy Wagner         297    1195    4.02     175   0.146
Joe Nathan           276    1145    4.15     159   0.139
Ugueth Urbina        330    1440    4.36     197   0.137
Jose Valverde        268    1093    4.08     149   0.136
Aaron Fultz          286    1098    3.84     147   0.134
Aaron Heilman        439    1738    3.96     230   0.132
Johan Santana        910    3326    3.65     433   0.130
Francisco Corder     302    1240    4.11     159   0.128
Huston Street        306    1186    3.88     150   0.126
Kerry Wood           273    1059    3.88     130   0.123
Jake Peavy           812    3159    3.89     384   0.122
Derrick Turnbow      271    1049    3.87     126   0.120
Duaner Sanchez       353    1265    3.58     151   0.119
Akinori Otsuka       276    1067    3.87     127   0.119
Brian Fuentes        321    1338    4.17     159   0.119
Kyle Farnsworth      277    1113    4.02     131   0.118
Cliff Politte        262    1021    3.90     120   0.118
Nothing too surprising here either. Batters swing and miss one out of every five pitches from Brad Lidge. Kirk Rueter on the other hand was at the bottom at just 3.1% or once every 33 pitches.
Pitches per Batter Faced
In answering a query from a friend I pulled up the pitchers in 2005 with the lowest and highest pitchers per batter faced. So here you go (these for over 200 BF).
Lowest                BF Pitches    P/BF
Carlos Silva         749    2292    3.06
Chien-Ming Wang      486    1594    3.28
Terry Mulholland     246     813    3.30
Greg Maddux          936    3096    3.31
Aaron Cook           357    1185    3.32
Jesse Crain          326    1089    3.34
Doug Waechter        692    2324    3.36
Scott Erickson       249     837    3.36
Josh Towers          876    2948    3.37
Jason Johnson        888    2995    3.37
Paul Wilson          224     761    3.40
Chad Qualls          329    1118    3.40
Mike Timlin          342    1169    3.42
Jon Lieber           912    3125    3.43
Brad Thompson        225     772    3.43
Brad Halsey          700    2413    3.45
Brian Lawrence       852    2944    3.46
Roy Halladay         553    1911    3.46
Paul Byrd            842    2915    3.46
Mark Mulder          868    3006    3.46
The lowest list is populated by guys who neither strike many out nor walk many. Carlos Silva walked just 9 guys and struck out 71 in 188.3 innings.
Highest               BF Pitches    P/BF
Ugueth Urbina        330    1440    4.36
Russ Springer        246    1059    4.30
Scott Eyre           278    1192    4.29
BJ Ryan              290    1243    4.29
Al Reyes             244    1044    4.28
Jorge De La Rosa     208     887    4.26
Andrew Sisco         329    1401    4.26
Al Leiter            670    2848    4.25
Matt Thornton        262    1109    4.23
Ron Villone          287    1214    4.23
Damaso Marte         213     898    4.22
Brian Fuentes        321    1338    4.17
Jeremi Gonzalez      244    1017    4.17
Joe Nathan           276    1145    4.15
Michael Wuertz       319    1323    4.15
Juan Rincon          319    1318    4.13
Brian Bruney         230     946    4.11
Francisco Corder     302    1240    4.11
Jason Frasor         305    1251    4.10
Joaquin Benoit       369    1509    4.09
These guys, however, walk and strikeout a lot of guys. Urbina struck out 97 and walked 39 in 79.7 innings.
QuesTec
In doing some research for a THT article I ran across these interesting articles on QuesTec.
Confessions of a Questec Operator - August 2004
Prospectus Q&A - December 2003
I've also posted a couple things in the past on the topic here and here, the second of which describes the interesting article Robert K. Adair wrote on the subject for volune 32 of The Baseball Research Journal.
Thursday, October 20, 2005
Click on Baserunning
I missed this before but James Click, who wrote an excellent piece on baserunning for the 2005 Baseball Prospectus, has added some additional research on the Baseball Analysts site recently.
In his article he takes a second look at whether particular hitters have a tendency to advance runners more or less than average. In his BP article he concluded that there really wasn't a tendancy based on season to season correlations - a fact he recounts in the recent piece.
However, he then gathers a larger sample size by making comparisons across even and odd years over an entire career. What he finds is a correlation coefficient of .249, not exactly strong but definitely moving in the right direction. His conclusion:
"Batters show a huge degree of variance from season to season when it comes to advancing baserunners more than the runners would advance themselves, but over a career, there are some batters who will move runners around the bases a little more often than their lighter-hitting counterparts."
Well done.
Wednesday, October 19, 2005
It's Killer B Time
After the Astros 5-1 win put them in the World Series versus the White Sox tonight I broke out my series simular I wrote during last season's playoffs and ran 100,000 simulations of the series.
The simulator uses as input each team's home and road winning percentages and then uses a formula I first saw in one of the Baseball Abstracts to calculate the winning percentage of the home team in each game. For example, if you had teams A and B team A's winning percentage in home games would be:
A = (A.HomeWPct - (B.AwayWPct * A.HomeWPct)) /
((A.HomeWPct + B.AwayWPct - (2 * A.HomeWPct * B.AwayWPct)))
The simulator then uses these percentages with some randomization to "play" each game in 2-3-2 series format.
In any case my results were that the White Sox would win the series 64.2% of the time and the Astros 35.8% of the time. The outcomes are shown in the following graph:
I certainly think the Astros have a better chance than this given the strength of their big three but it will be difficult for them to score runs. The Sox bullpen may also be rusty having thrown just 2/3 of an inning in the ALCS.
First to Third
One of the interesting quotes in the Jeff Angus piece on Mike Scoscia was where Scoscia said:
"We can't manufacture on base, so we can't afford to have any wither on the vine. Last year, we went from 1st to 3rd {base} 99 times; we were thrown out six times. Conversely, the Oakland Athletics who play a very passive running game because they don't want to run into outs went {from}1st to 3rd, I believe it was 31 times...you can get those numbers...and they got thrown out 4 times."
This is interesting to me since my base running framework tracks what happens when a batter singles with a runner on first. For 2004 I had the Angels as having 271 such opportunities and reaching third 74 times or 27.3% of the time. I also had them scoring 3 times and getting thrown out 7 times. For the A's I calculated that they reached third 58 times in 235 chances (24.7%) while scoring twice and getting thrown out only once.
Now in my numbers I'm only including those times when second base was not occupied. When I include the times when a runner was on second the Angels had 375 opportunities and made it to third 107 times, scoring four times and getting thrown out 10 times. The A's advanced to third 81 times in 340 chances scoring twice and getting cut down four times.
Based on this I'm not sure how the Angels are calculating their numbers but the point is that they're not that different from other teams and in fact the number of baserunners they lose more than makes up for the small difference in advancement. The reason that they score runs with less is that they hit so well with runners in scoring position both in 2004andd 2005.
In any case here are the numbers for 2005 when second base was unoccupied sorted in order by how often the team advances to third on a single (these are not park adjusted of course).
Team      Opp  Second     Pct   Third     Pct  Scores    OA
NYN       205     128   62.4%      73   35.6%       3     1
TBA       238     156   65.5%      77   32.4%       4     1
NYA       282     185   65.6%      91   32.3%       4     2
CHN       226     154   68.1%      69   30.5%       1     2
CHA       242     167   69.0%      73   30.2%       1     1
KCA       233     161   69.1%      70   30.0%       0     2
ANA       244     168   68.9%      72   29.5%       2     2
ATL       202     143   70.8%      59   29.2%       0     0
HOU       198     138   69.7%      57   28.8%       1     2
OAK       232     164   70.7%      66   28.4%       2     0
TOR       254     177   69.7%      72   28.3%       1     4
SFN       235     167   71.1%      64   27.2%       1     3
TEX       199     141   70.9%      54   27.1%       2     2
MIL       204     143   70.1%      55   27.0%       1     5
FLO       244     177   72.5%      65   26.6%       2     0
CIN       198     145   73.2%      52   26.3%       1     0
COL       228     164   71.9%      59   25.9%       2     3
WAS       217     158   72.8%      56   25.8%       0     3
ARI       221     163   73.8%      57   25.8%       0     0
PHI       226     157   69.5%      58   25.7%       6     5
LAN       221     161   72.9%      56   25.3%       2     2
SLN       225     166   73.8%      57   25.3%       1     1
BAL       229     169   73.8%      58   25.3%       1     1
BOS       257     189   73.5%      65   25.3%       1     1
DET       246     181   73.6%      61   24.8%       2     2
PIT       227     167   73.6%      56   24.7%       2     2
SDN       208     152   73.1%      51   24.5%       0     5
CLE       213     158   74.2%      52   24.4%       0     3
MIN       243     182   74.9%      57   23.5%       2     2
SEA       197     147   74.6%      45   22.8%       4     1
Looks like the Phils were the most high risk-high reward team getting thrown out five times but also scoring six times.
Things to Read
Here are a couple of interesting things I read this week in between writing game summaries of the playoffs using Win Probabilities.:
Part I:The Sabermetrically-Challenged L.A. Angels Are All About Numbers
Part II: In Scioscia's Words:People Who Think They Know All The A.s Haven't Asked the Right Questions
When I publish the results of my baserunning framework for 2005 I'll have more to comment on here, especially on the advancement of runners from first to third discussed in Part II.
Has Homerun Hitting Changed in Major League Baseball
This study concludes that aside from Sosa, Bonds, and McGwire, homerun hitting has not changed in a statistically significant way and so it questions the effects of steroids. His conclusion:
"On the whole, there is no evidence of increased home run hitting in MLB that cannot be accounted for by the expanded schedule, more teams and games, a slight rise in the number of at bats per game, and the feats of a three magical hitters during four years when they made history. Steroids do not come into the picture, nor is there any need to invoke explanations that go beyond the natural variation of home run hitting, at bats, chance, and the laws of extreme human accomplishment."
I'm interested to hear what others think.
Monday, October 17, 2005
I Take That Back
Last week I congratulated broadcaster Tim McCarver on his intuition when he noted on a broadcast that Derek Jeter never gets thrown out on the bases. In that post I noted that in 248 opportunities from 2000 through 2004 Jeter was thrown out only twice (once each in 2003 and 2004).
However, I now have 2005 PBP data and come to discover that in 2005 Jeter was thrown out three times in 69 opportunities and so now has been nabbed five times in 317 chances over the last six years. The leader in getting thrown out was Brewer's rookie Richie Weeks who was cut down 5 times in 2005.
Sunday, October 16, 2005
The Probability of Chris Burke-tober
As seemingly happens every post season the discussion about clutch performers comes to the forefront. The excellent performance of the Astros Chris Burke (now affectionately called Chris "Burke-tober" by his hitting coach Gary Gaetti) has only magnified the usual discussion.
So it was no surprise that in this morning's Denver Post was an article titled "Clutch? It's succeeding in bright lights" where reporter Tony Renck talks about the different definitions of clutch from various player's perspectives that fall into the camps of consistency and timing.
One comment I thought was interesting, and that betrays a lack of understanding about the nature of variability, was Lance Berkman's view that:
"The way I see it, if you hit .330 during the regular season, then you need to hit .330 in the playoffs...You can't expect a guy who batted .250 all year to suddenly hit 100 points higher."
What's wrong with Berkman's view is that it fails to take into account the variability involved in an activity like hitting at the major league level. In a single post season a player gets at most 80 at bats and with such a small sample size there is a great deal of variability in any player's performance even if you know what their true ability is. For example, using a standard binomial distribution a .250 hitter will hit over .250 fully 42% of the time and between .300 and .350 more than one time in 10 (11%).
Of course in actuality most hitters who get "hot" in the post season do so in a particular series. In a seven game series a .250 hitter would hit between .300 and .367 almost 15% of the time. Below is the distribution of those probabilities for a .250 hitter over 30 at bats.
You'll notice that there is significant space under the curve to the right of the 8 on the x-axis which represents a .267 average over 30 at bats.
The fact that Alex Rodriguez went 2-15 in the Division Series represents nothing more than natural variation and a result that was not unlikely.
Categorical Representation
I was surprised to read some pretty hard hitting criticism of President Bush by George Will in one of his recent columns.
In that column Will is supporting the "presumptive opposition" of the Harriet Miers nomination to the Supreme Court and two grounds. First, he opposes her nomination because there is "no evidence" that she has the talents or standing in the judicial community to be considered for one of the top legal posts in the country. He lack of a paper trail, while perhaps beneficial in the confirmation process, is an indication that she may not have the talent nor the inclination for the constitutional reasoning required on the court. As a result the burden is on Miers in the hearings to demonstrate she has the capacity and talent for the job. One assumes that Will thinks that if the senators do their job, they'll likely reveal that she doesn't.
More interesting however, is Will's assertion that Bush has accepted the notion that the Supreme Court is "an institution of representation" both since he nominated a woman to fill O'Connor's seat and because of the strategy the White House has used to defend her.
Within his argument I really liked his description of the dual problems with such an approach.
"Under the rubric of 'diversity' - nowadays, the first refuge of intellectually disreputable impulses - the president announced, surely without fathoming the implications, his belief in identity politics and its tawdry corollary, the idea of categorical representation. Identity politics holds that one's essential attributes are genetic, biological, ethnic or chromosomal - that one's nature and understanding are decisively shaped by race, ethnicity or gender.
Categorical representation holds that the interests of a group can only be understood, empathized with and represented by a member of that group."
I think Will makes an important point about the difference between positions that are representative and those that are not. While I can buy to some degree that argument that representatives or even senators should be based to a degree on categorical representation, on the Supreme Court what we as Americans should want I would think are the best legal minds available, not a court that "looks like America". The analogy I would use is that of a surgeon. Would you rather be on the operating table looking at a surgeon that fits your race, ethnicity, and gender or the one that has the most skill?
It'll be an interesting confirmation process to watch and I think Bush has given his opponents needless ammunition in his selection of Miers.
Thursday, October 13, 2005
The Ancestor's Tale: A Pilgrimage to the Dawn of Evolution
This is a book by Richard Dawkins, author of The Selfish Gene, I read earlier this year but wanted to post a quick review.
The interesting thing about this book is that as the subtitle "A Pilgrimage to the Dawn of Evolution" suggests, Dawkins takes the reader on an evolutionary trip through a series of 40 rendezvous points that progress further back in time ala the Canterbury Tales. For example, he starts at Rendezvous 0 - All Humankind, and ends at Rendezvous 39 - Eubacteria with each rendezvous marking a branch or connecting point where more of life's diversity shares a common ancestor.
At each point he not only describes the varieties of life that join the pilgrimage (usually using extant species) but also crafts one or more "tales", such as "The Neanderthal's Tale" or "The Duckbill's Tale" that includes a short essay on some key evolutionary concept or recent research on a particular topic. Some of my favorites include "The Handyman's Tale" where he explores the relationship between brain size and body mass and shows where Homo habilis, Homo erectus, and other primates fit on the scale as compared to all mammals, "The Duckbill's Tale" where he discusses the sensory nature of the bill, "The Elephant Bird's Tale" where he links the evolution of large flightless predatory birds and plate tectonics, "The Salamander's Tale" that shows the continuous nature of modern populations, and "The Cauliflower's Tale" where he introduces the relationship between body mass and metabolic rate (a 3/4 slope in a log-log graph) known as Kiebler's Law that was explicated in a recent theory regarding supply networks called WEB.
Fascinating stuff and each tale is short enough for a quick read when you carry a book along, as I do, in the course of your day. The discussion is wide-ranging and allows you to wrap your mind around a variety of different concepts. Some of the tales are actually written by Yan Wong.
One of the reasons I like the approach of the Pilgrimage with his connecting extant species with the most recent common ancestor is that it helps illustrate the idea of the bush as opposed to that of the ladder as the more proper icon for illustrating how evolution has proceeded. The species that join at each rendezvous can be thought of as the tips of the twigs in an ever expanding bush of evolution rather than a rung on a ladder ascending or descending in complexity.
My only criticism of the book is that since Dawkins is something of a celebrity in the scientific world he apparently gets a lot of leeway in his books from his editors. In this book you'll find random potshots at political conservatives and fundamentalist Christians that are oddly out of place and distract from the generally intellectually stimulating content.
With that caveat I would definitely recommend the book.
Eddings Blows It
I'm sure everybody else will weigh in on this so I suppose I will too.
To me, clearly Doug Eddings blew the call. From looking at the replays it would seem that Josh Paul caught the ball cleanly and Eddings made a strike three call by extending his right arm. Then when Paul rolled the ball back to the pitcher he clearly signaled that A.J. Pierzynski was out by pumping his right fist. Apparently, he didn't say anything at all either way and Paul contends that most umps will verbally signal that there was "no catch".
The smoking gun that shows Eddings was wrong was Aaron Rowand's at bat just prior to this play. Rowand swung at a ball low and away and Paul blocked it. Eddings extended his arm to make the strike three call and then kept it extended until Paul tagged Rowand and only then did he pump his fist to signal strike three.
I listened to the umpires press conference after the game and the questioners were terrible and never called Eddings on the fact that he called Pierzynski out at the plate. Eddings said that was his typical strike three "mechanic" but wouldn't admit to calling him out. The crew chielf was down the line and so on the field and at the press conference he was simply covering for Eddings. Third base umpire Ed Rapuano also didn't appear to see anything either way and so could not offer any assistance.
It's too bad that Eddings couldn't admit he was at least confused. Clearly to me, unless another umpire over rules the call through an appeal, the call on the field should stand, in this case the call that Pierzynski was out.
Wednesday, October 12, 2005
Jeter and McCarver
The other night during the Angels win over the Yankees Tim McCarver noted that Derek Jeter doesn't get thrown out bases very often. Since I sometimes am one of those people that criticize broadcasters like McCarver, I thought I'd do the opposite and confirm McCarver's intuition.
From 2000 through 2004 Jeter was thrown out just twice in 248 opportunities when on first and the batter singled or doubled or on second when a batter singled. Only Ray Durham who wasn't thrown out once in 203 opportunities and Bernie Williams who was thrown out once in 215 opportunities and Jimmy Rollins who was thrown out once in 180 opportunities were much better. Others who were also very good were Carlos Guillen (1-176), Ichiro Suzuki (2-246), Nomar Garciapara (1-174), Barry Bonds (2-241), and Tim Salmon (1-174). Of course Jeter, Durham, and Rollins are also among the best baserunners in baseball and all ranked in the top 15 in the number of incremental runs gained.
Score one for McCarver.
Tuesday, October 11, 2005
Jacobs Field and the Fabric of the Cosmos
Here is something interesting that seems to me requires an explanation. As Dave Studeman pointed out in one of his excellent "Ten Things" columns Jacobs Field in Cleveland appears to induce more ground balls than other parks.
The following is the raw data from Baseball Info Solutions for the past three years.
Jacobs Field
         BIP grnders  flysof  flysif  liners grnders  flysof  flysif  liners
2004    4642    2096    1427     182     859   45.2%   30.7%    3.9%   18.5%
2003    4589    2019    1261     161    1010   44.0%   27.5%    3.5%   22.0%
2002    4483    2044    1259     181     923   45.6%   28.1%    4.0%   20.6%

Indians Road Games
2004    4808    1974    1667     214     880   41.1%   34.7%    4.5%   18.3%
2003    4754    1953    1439     186    1061   41.1%   30.3%    3.9%   22.3%
2002    4571    1917    1431     176     951   41.9%   31.3%    3.9%   20.8%

Ratios
     grnders  flysof  flysif  liners
2004   1.100   0.887   0.881   1.011
2003   1.071   0.908   0.897   0.986
2002   1.087   0.897   1.049   0.990
So the numbers have been consistent over the past three years and average out to around 1.086, or 8.6% above average.
So the question of the day is, what factors could conspire to make one ballpark induce more ground balls than another? Or should the question be reversed and are the additional ground balls really a suppression of fly balls?
I've thought a bit about this and nothing really comes to the forefront in terms of explanations. Could it be something about the park (prevailing winds?) that pushes foul popups into the stands and provides more chances for ground balls? Could it be the hitting background that induces hitters to hit the top half of the ball? Is the mound a little higher or lower? Could it be an anomaly in the fabric of spacetime that creates an area of concentrated gravity in the vicinity of the infield at Jacobs Field? I'm up for any other explanations as well...
By the way, I've checked the BIS data against another data source and although the scoring guidelines differ between the two sources the second source confirms the well above average ground ball rates at Jacobs Field.
Look for complete batted ball park factors in The Hardball Times Baseball Annual 2006.
Taboo: Why Black Athletes Dominate Sports and Why We're Afraid to Talk About It
This book by Jon Entine was published in 2000 and discusses this very sensitive topic in great detail. Entine once produced a special on the domination of black athletes for NBC with Tom Brokow and used much of the material I assume in assembling this book.
I was turned on to this book by Will Carroll's short interview of Entine on a recent Baseball Prospectus Radio show, and like Carroll, I've always been fascinated by the subject and think it deserves more attention.
In short his thesis is that "biology circumscribes possibility":
"the opposing and incompatible claims that black athletic success can be explained by environmentalism or evolution are equally simplistic. Sports success is a bio-social phenomenon. There is extensive and persuasive research that elite black athletes have a phenotypic advantage - a distinct skeletal and musculature, metabolic structures, and other characteristics forged over tens of thousands of years of evolution...Preliminary research suggests that different phenotypes are at least partially encoded in the genes- conferring genotypic differences, which may result in an advantage in some sports."
The book is divided into five sections with by far the largest two (parts III and IV) being a history of race science and sports that covers over a third of the book.
The history is interesting and well written and I especially enjoyed his bios of Jack Johnson and Joe Louis who took dichotomous approaches to their interaction with the white world. He also includes a wonderful description in part II of Kenya's running culture and the domination of Kenyan athletes from the tiny Nandi region of Kenya where more than 20% of all winners of international distance running events are born. Entine calls this region "the greatest concentration of raw athletic talent in the history of sports."
Also in part II he documents very well the domination of those of West African descent in sprinting and East African descent in distance races by noting that (as of 2000) of the top 500 100-meter times recorded African Americans of West African descent hold 494 of those and that East Africans hold over 50% of the top middle and long distance times. He also spends a little time on other sports including the success of black baseball players after Jackie Robinson and how becoming an NBA player is difficult for an African American (1 in 4,000) but far more so for a white (1 in 90,000).
In part VI he discusses women's athletics and focuses in on how the superiority of black females was masked from the mid 1960s through the early 1980s by the steroid culture of the Soviet block athletic machine and how black females have come to the forefront.
Part V, however, is where Entine makes his case for phenotypic and genetic differences between the races that lead to black domination of sports. Specifically, he cites a number of studies and concludes that blacks of West African descent generally have:
- relatively less subcutaneous fat on arms and legs and proportionately more lean body and muscle mass, broader shoulders, larger quadriceps, and bigger, more developed musculature in general
- smaller chest cavities
- a higher center of gravity, a generally shorter sitting height, narrower hips, and lighter calves
- a longer arm span and "distal elongation of segments" - the hand is relatively longer than the forearm, which in turn is relatively longer than the upper arm; the foot is relatively longer than the tibia (leg), which is relatively longer than the thigh
- faster patellar tendon reflex
- greater body density, which is likely due to higher bone mineral density and heavier bone mass at all stages of life, including infancy (despite evidence of lower calcium intake and a higher prevalence of lactose intolerance)
- modest, but significantly, higher levels of testosterone ( 3 to 19%), which is anabolic, theoretically contributing to greater muscle mass, lower fat, and the ability to perform at a higher level of intensity with quicker recovery
- a higher percentage of fast twitch muscles and more anaerobic enzymes, which can translate into more explosive energy
He also notes that East Africans tend to:
- have more energy producing enzymes in the muscles
- an apparent ability to process oxygen more efficiently, resulting in less susceptibility to fatigue
- a slighter body profile and a larger lung capacity than whites or West Africans, which translates into greater endurance
- hail from a region 6,000-8,000 feet in elevation which is deemed optimum for middle and long distance training
Entine says that these conclusions aren't really in question and they indicate at least some genotypic difference, all of which makes me wonder why the question is so...well...taboo.
The answer of course is that admitting there are genetic differences in a population that lead to a greater general adaptability to certain sports is inherently connected with the possibility that there are other genetic differences that manifest themselves in the non-sporting world - in other words, IQ or general intelligence leading to success in the modern world.
Entine correctly makes this connection and explores its historical roots time and again and finally makes a plea for severing the link by arguing that even if the former is true, the latter need not be.
Regardless of whether it makes logical sense to sever the link, what I always find so fascinating in this debate is the basic misunderstanding about variation within a population, variation between populations, and their meaning for the individual and for the tail end of the distribution.
First, what Entine is saying is not that every black is a better athlete than every white. Clearly this is not true by observation. In fact, he's not saying anything specific about any individual of any race. What he is saying is that as a population group, West Africans have certain physical traits that are to some extent genetic and that differ from the populations of European whites, Asians, or East Africans.
To illustrate his point think of those characteristics or physical traits being spread out through a population in a standard distribution (a bell curve). Different populations then will have different distributions and if one population generally has fewer of these traits, their bell curve will overlap with that of another population with a higher concentration of the traits but be offset. In that case there will always be many in the second population that have that characteristics in more frequency than many in the first population. Hence the fact that there are some Asians who can out jump some West African blacks. But, and here is the key - the right tail of the second population's distribution will end well before the right tail of the first, and it is here that elite athletes reside. In other words, the phenotypic differences between populations are magnified at the extreme ends of the distribution.
This fact also explains why those, like the late Stephen Jay Gould, who eschew the entire concept of race are mistaken when they argue that race can't matter because there is often more variation within a population than there is between populations. That may well be true but it is the offset or overlapping nature of those population distributions that produces the inequality we see in elite sports.
Entine is also not saying that individual black athletes don't have to train or do not have to be serious competitors. In fact he argues throughout the book that almost all world class athletes require much more than their physical traits to be successful, not the least of which are drive, courage, and sacrifice. However, those physical gifts are a necessary condition for success at the elite level and so phenotypic differences in a population act like a sieve that let pass only those whose traits better adapt them to success. Biology does indeed circumscribe possibility.
From a statistical perspective here is an enlightening paper that outlines this key concept and how it relates to Kenyans and distance running with the central point being:
"Near the limits of human performance, subtle differences between groups become greatly magnified. In world-class competition, whether for Nobel Prizes or Olympic gold, such small variations in group abilities profoundly influence tribal representation in the winner's circle...we estimated the mean difference in sprinting ability between white and African Americans to be about 0.82 standard deviations. Despite this large group difference, if a white and black were selected randomly from their respective populations, the white would have almost a one in three chance of being the faster sprinter. Thus, a gap as big as 0.82 SD, which might go undetected in the ordinary scheme of life, is enough to create an all black elite at the top."
The paper then goes on to perform a statistical test given the distribution of Nandi (Kenyan) and West European elite runners and concludes that "a random Nandi is 524 times more likely to make the 1500m best-runner list than his West European counterpart!...Only 1 in 5000 young Nandi men will be admitted to this exclusive circle. For Euros, the number is 1 in 2.6 million"
This statistical conclusion is buttressed by a anecdote that Entine shares comparing Scandanavian runners with Kenyans.
"he [Bengt Saltin, director of the Copenhagen Muscle Research Center] brought a half-dozen established Swedish national class runners to...Kenya, in 1990 to see how they might match up against up-and-coming East African schoolboys. It was a demoralizing experience for the Swedes. National champion after national champion was soundly troucned in races from 800 meters to 10 kilometers. Stunned, Saltin estimated that in this one tiny area of teh Rift Valley there were at least five hundred school boys who could best his national champions at 2,000 meters."
Longest Playoff Game? Think Again
It has been widely reported that the 18-inning, 5 hour and 50 minute Astros 7-6 win over the Braves was the longest postseason game in baseball history.
But as is usual a SABR member, Phil Lowry in this case, keeps track of such things and has reported that there have been at least three postseason games that have gone 20 or more inning, one of which occurred just this year. They are:
- 6-Sep-1990, California League: Stockton 5, Bakersfield 4, 22 innings
(suspended after 21, resumed the next day) - 7-Sep-2005, South Atlantic League: Kannapolis 4, Charleston 3, 21 innings
- 7-Sep-1990, American Association: Omaha 8, Nashville 7, 20 innings
Monday, October 10, 2005
Angels and Moneyball Redux
Last night in the Fox broadcast of Game 4 between the Angels and Yankees Tim McCarver noted that broadcasters catch a lot of flack for not being up on the latest statistics. He was quick to point out though that the Angels had hit .296 with runners in scoring position which is why they needn't be that concerned with Moneyball strategies like focusing on OBP.
Interestingly, Thom Brenaman seemed almost apologetic when mentioning that Billy Beane didn't actually write Moneyball and McCarver was quick to chime in that Michael Lewis did. Apparently, for them the book is anathema.
McCarver went on to say that Mike Scoscia indicated that his Angels go from first to third more than twice as often as the A's do since they focus on getting runners in once they get on.
This is the same topic I wrote about back in April. In that piece I noted that the Angels were 3rd in the league last season in hitting with runners in scoring position and hit .291 with runners on which helped account for their outperforming their runs created estimates.
This season the A's and Angels by comparison looked as follows:
         Runs   RC   BsR
Angels   761   738   721
A's      772   741   727
Note: BsR is David Smyth's Base Runs formula.
So this season there wasn't quite as big a difference as in 2004 and in fact the A's overshot their estimates by a few more runs than the Angels. This was because the A's also hit well with runners in scoring position (.275) and with runners on (.272).
As for runners advancing I was not able to validate the numbers Scoscia gave for 2004 in the previous article using my baserunning framework and I don't have play by play data for 2005 yet. My sense is that Scoscia is using a measure that excludes certain kinds of hits and that his tracking has some bias in it.
Thursday, October 06, 2005
Too Small To Ignore
Yesterday the President and CEO of Compassion Wes Stafford spoke to the entire organization about his new book Too Small to Ignore: Why Children are the Next Big Thing published by Waterbrook Press. 
The book is a wakeup call that brings home the message that children matter and that those who have the power (which ultimately includes all of us) should use that power to be the voice for improverished children around the world. Wes grew up in rural west Africa (Ivory Coast) as the son of missionaries and lived among the people that Compassion now serves. He has a unique insight into the problem and the face of poverty that he also shares in the book in recounting some of his journey.
The book will hit stores October 18th but you can preorder from the link above.
Monday, October 03, 2005
NL Division Series
And here are the matchups for the NL.
The Central winning Cardinals will take on the Padres. 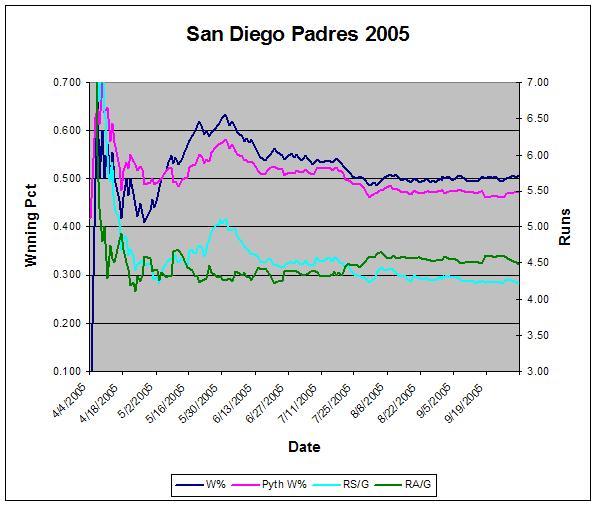
For the Padres a simultaneous offensive and defensive drop in late July led to their slide that allowed them to win their division tied with the 1973 Mets for the fewest wins by a division winner in NL history. Interestingly, they also appeared to get lucky early as evidenced by their Pythagorean winning percentage being consistently ahead of their actual winning percentage in early May. They then carried those extra wins all the way through September.
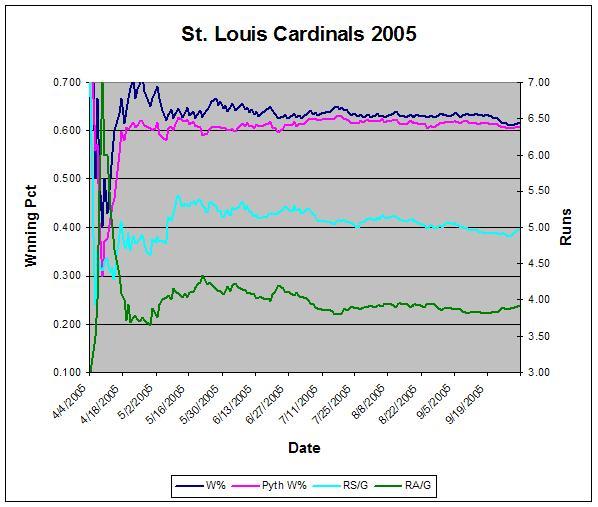
Not much to say about the Cardinals other than they were very consistent. Slight offensive and pitching slumps led to their losing a few extra games in the final weeks as they landed exactly on 100.
In the other series the Braves for the 14th straight time as winners of the East will take on the Wild Card winner Astros. 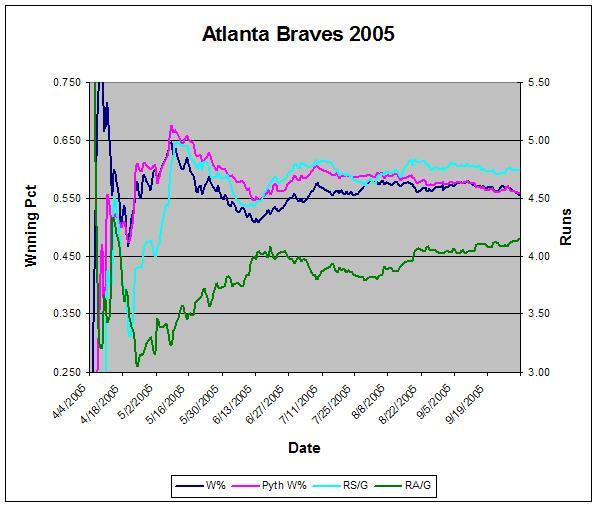
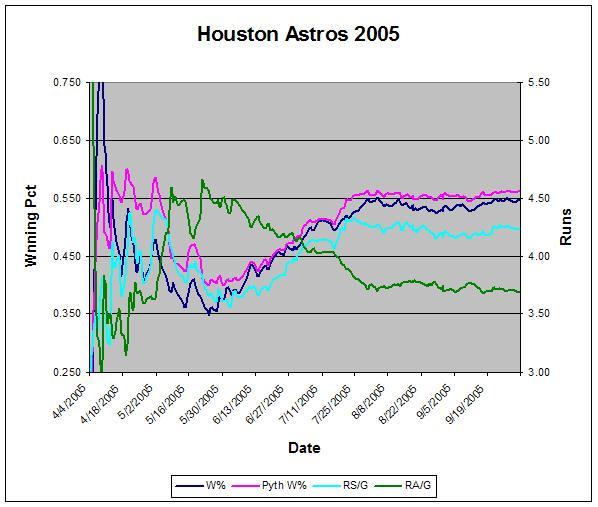
The Braves got excellent pitching early and then got hot again in mid June to overtake the slumping Nationals. The Astros had the farthest to climb of any team in teh playoffs as their miserable offense climbed from just over 3.5 runs per game in early June to end up near 4.25. Their pitching also improved markedly from mid May to mid August and then held the line the rest of the way.
AL Division Series
Well, the matchups are set for the first round of the playoffs.
In the AL the Red Sox, winners of the Wild Card will take on the White Sox winners of the Central. Here's a quick look at how the two teams got to where they are.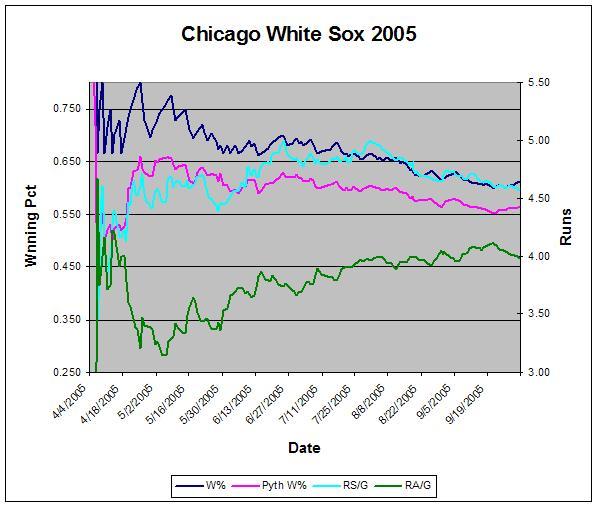

The Red Sox have far the better offense while the White Sox pitching staff righted the ship in the final weeks.
And in the other series the Yankees winners of the East will take on the Angels, winners of the West. 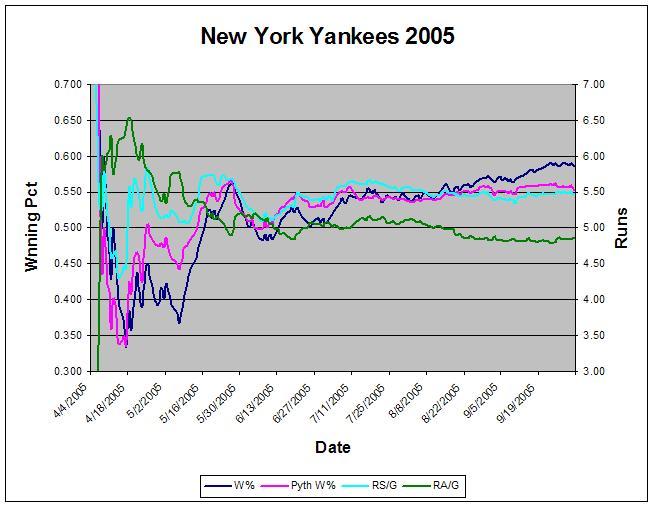
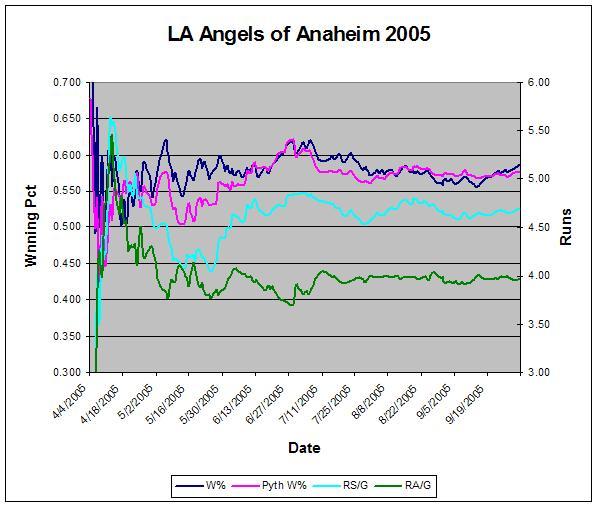
The Angels have by far the better pitching overall although the Yankees pitching in the final month that helped them to their 19-9 record in September.
125x125_10off+copy.jpg)


