
The Hardball Times Baseball Annual 2006 has shipped and I received my copies just yesterday. Dave Studeman, Aaron Gleeman, and the folks at ACTA did an outstanding job of putting the book together which contains all original content (no web article reprints) including articles by Bill James, Rob Neyer, John Dewan, and J.C. Bradbury among others and of course a number of articles by the regular THT crew.
I think you'll really like the additional information on batted ball outcomes and the articles by Studeman, Bradbury and THT's David Glassko that analyzes it. You can read a review of the book here by Stick and Ball Guy.
Yours truly has two articles in the book, one on lucky and unlucky teams for 2005 and the results of my baserunning analysis. The stats section includes the baserunning results for every player in the majors last season. Enjoy.
Tuesday, November 29, 2005
Hardball Times Baseball Annual 2006
Sunday, November 27, 2005
Sabermetrics Course
Thought some readers might be interested in this article, "Numbers crunch: Tufts course really packs 'em in" that discusses the class offered at Tufts titled EX-013, The Analysis of Baseball: Statistics and Sabermetrics and taught by SABR members Andy Andres and David Tybor, and Morgan Melchiorre.
Very cool indeed. Why couldn't I take that kind of class in college? I'm also proud to report that this site is listed on their links section.
History Repeating Itself
SABR's Paul Wendt posted a pdf of a fascinating article by F.C. Lane titled "Has the 'lively' Ball Revolutionized the Game?" The article appeared in the September 1921 issue of Baseball Magazine.
I've written about F.C. Lane before, a man who was in many ways ahead of his time (particularly in his understanding of performance analysis), and you can read about his fascinating book Batting here.
As was the case with many in and around the game during this period, Lane grew up when pitching dominated and so it's not surprising that he viewed the exploits of Christy Matthewson, Smokey Joe Wood, and Walter Johnson as normative and was alarmed at the era that Ruth was then ushering in. In this article Lane writes about what he considers the "foremost problem in baseball today."
He puts it this way.
"And since we all know that pitching is the bed rock of baseball, when we disturb the foundation of the game, we shake the superstructure."
Because of his knowledge and reverence for statistics he also rightly compares the inflation of batting statistics to the devaluation of currency during the war - a problem our own generation is now coping with in the "Lively Player Era". The article then explores the various reasons given for the devaluation.
Lane begins by reporting on his investigation of the ball itself in order to quelch the rumors that it is being manufactured differently and that the owners are responsible - a charge by the way that is recounted by Leonard Koppett in his book The Thinking Fan's Guide to Baseball in chapter 28 where he says that in "1920 the ball was made livlier again...That bit of history is well known." Apparently Lane would have disagreed.
In any case Lane toured both Reach (the ball used in the AL) and Spalding (that used in the NL) factories and concluded that the balls themselves were manufactured in exactly the same way, albeit with better materials and particularly better quality and more elastic yarn since the end of the war. He also specifically dismissed those who claimed that the balls were being made livlier on purpose, reporting on his interviews with the league presidents. In the end his conclusion on the manufacture of the balls was that:
"The ball in use in both major leages is actually somewhat livlier than it was during the war period due to better materials and possibly better workmanship. But there is no evidence of any great change in the ball itself from year to year."
He then went on to discuss the four other factors he saw as also contributing and that in sum were more important than differences in the ball itself.

"Ruth is more than a slugger, he is a homerun hitter. Fortunately for him, he began as a pitcher. A pitcher is not expected to hit. Therefore, he can follow his own system without managerial interference. Ruth made the most of this opportunity...I have tried to make myself a batter, which is something quite different. A batter is a man who can bunt, place his hits, beat out infield drives, and slug when the occasion demands it, but he doesn't slug all the time."
To me, and contrary to Koppett who views changes in the ball as most important, this factor is the first among equals. In Batting Lane also attributes Ruth's ability to hit homeruns and others ability to follow his example to adopting a particular style or "speciality" of hitting rather than the influence of different baseballs. The style that Ruth popularized along with the fact that the reluctance of owners to make rules that handicapped Ruth in light of the Black Sox scandal served to usher in the new slugger's era.
In conclusion Lane then discussed what he saw as minor contributing factors. He mentioned that it was becoming more common for fans to keep foul balls where once they were forced to return them which had the consequence of introducing many new balls into play. He also noted that the transition to the new pitching rules had caused pitchers to temporarily fall behind in the arms race and that soon they would develop new strategies to cope. The latter introduction of the slider and the resurgence of the knuckleball are two examples of how pitchers did finally adapt. Finally, he also mentions that hitters had grown in confidence from the abolition of the freak deliveries, which in the past had them more fearful of injuries.
In the end Lane I think correctly attributes the rise in offense to, for him, this unhappy confluence of factors and seems to look forward to the day when pitching would regain prominance. There is a parallel here to our own day where the confluence of factors including weight training, steroids, perhaps lower seems on the ball, the effect of aluminum bats on the training of pitchers, and the abscence of intimidation among others, have all contributed to higher offensive output. And as in those days there are those like Koppett who continue to believe that the ball was made livlier starting in 1993 despite tests that shows the coefficient of restitution hasn't changed.
Wednesday, November 23, 2005
Dinner with Rocky Mountain SABR
Last Saturday night my daughter and I drove into Denver for the annual Rocky Mountain SABR banquet (did I ever mention you should join SABR?). The dinner was held at the Denver Athletic Club and attended by around 25 members and their spouses and a few children. The event is sponsored by the Rockies and included silent and live auctions as well as four speakers with the keynote delivered by Jim Burris, a baseball establishment in the Denver area.
When I was a member of the Monarchs SABR chapter in Kansas City I was impressed with the level of speakers they were able to get including Allard Baird, Brian McRae, and John Wathan at their annual mid-winter meeting but having a dinner with the same quality was even better.
The program was led off by Ed Henderson who is the local baseball guru on ESPN radio 560 out of Denver and who was an area scout for the Marlins in the 90s and now with the Pirates. I believe he signed Roy Halladay, Shawn Chacon, and Brad Lidge among others. Henderson spoke eloquently about our shared passion and reminisced about his first trip to Fenway Park and his chance to see Ted Williams - alas a chance he missed as the game was rained out. He also spoke about his trip to the 1999 All Star game and how great it was to see Williams on the field.
Next up was Rockies radio broadcaster Jack Corrigan. Corrigan spoke on a range of subjects including Irish influence in the game from John McGraw, Connie Mack, and Joe McCarthy to Ed Delahanty and King Kelley. He also reminisced about his chance to see Teddy Ballgame at the end of his career when his dad took him to old Municipal Stadium in Cleveland. After a Williams at bat his dad turned to him and said, "now there's a hitter", and nothing else. Corrigan was also pretty optimistic about the Rockies chances in the next few years and drew a parallel with the Indians of the early 1990s. He thinks the Rockies are doing the right thing in focusing on a youth movement and noted that three of the top nine vote getters in the Rookie of the Year award were Rockies (Garrett Atkins, Clint Barmes, and Jeff Francis). Corrigan was most upbeat about the pitching and noted that in the next few years we'll all be much more familiar with the Latin surnames like Carvajal.
He also said, however, that the Rockies chances begin and end with Todd Helton. I disagree. Helton's monster contract at $12.6M in 2005 and rising is an albatross for a team that will likely have a payroll less than $60M in 2006. His translated batting line for 2005 of .303/.431/.518 is very good but not worth more than 20% of the payroll, especially at first base where an adequate replacement in Ryan Shealy awaits. Helton has been a wonderful player but the diminishing returns (he'll turn 32 next season) on the contract that pays him an average of $15.7M per year through 2011 indicate that the Rockies would be better off to try and trade him if any takers could be found. The problem with that strategy of course is that he is their only marketable player at the moment until Matt Holliday, Brad Hawpe or someone else becomes a star (don't count on it being Clint Barmes).
Finally, he mentioned the rumor that the Rockies and Marlins are talking about the possibility of bringing Paul LoDuca to Denver. While at first blush that sounds interesting since the Rockies are in need of catching and the Monforts (the owners) have talked about finding a veteran catcher, there would probably be a tendency to over pay for LoDuca because of his name recognition and it would be foolish to give up some of the young pitching talent for him. In 2006 he'll be five years removed from his outlier year of 2001 where he hit .320/.374/.543. Since then he's been more like .280/.335/.400 which isn't bad for a catcher but nothing to give up the farm for. He'll also be 34. Not a good age for a catcher.
Next at the podium was the national president of SABR John Zajc. He spoke briefly about the accomplishments of SABR over the past year and how the organization now stands at 6,972 members and is poised to top 7,000 for the second time in its history. He also mentioned that in addition to several retired players who are members there is one active pitcher who is a member whose name I didn't catch.
At this point member Paul Parker was given the annual award for his contributions to the chapter. Paul is employed by the Rockies and is the Manager of the Community Fields Program and also the Club Historian. He's been instrumental in getting the Rockies support for the chapter which includes assisting with a project to place plaques at the various sites professional baseball was played in the Denver area. The first plaque will go up at the site of old Mile High Stadium where the Denver Bears played for so many years.
Before Jim Burris took the stage Paul wrapped up the silent and live auctions by auctioning off four signed baseball bats. A signed Cal Ripken bat went for $170, a Mike Schmidt for $160, and a Willie Mays for $700. The final bat was one signed by 30 members of the 1969 Mets which started at $525 but didn't get any takers. All the proceeds from the auction went to The Colorado Rockies Museum and Learning Center. The center will feature exhibits on baseball in the Rockies as well as traveling exhibits from the Baseball Hall of Fame. A learning center is planned as well, so that baseball fans of all ages may learn more about their favorite sport. My daughter bid a few dollars on a set of 2004 Sky Sox cards which she won in the silent auction.
Burris enjoyed a long career in baseball and was GM of both the Denver Bears and Denver Broncos, assistant to Ford Frick, President of the American Association and Texas League, as well as being a journalist. His talk consisted of a series of anecdotes about individuals he's known including Dizzy Dean, Pee Wee Reese (whom he considered his best friend in the game), Paul Richards (knew more about baseball than anyone else), Carl Hubbell (whom he visited in a home in Mesa Arizona in the 1980s and was able to get some help for), Billy Martin (who managed for him Denver), and Rogers Hornsby (a guy that nobody liked but that he got along with).
While some of the anecdotes were well known others were more personal. For example, he told of how Martin called him in 1968 and asked if he could throw a party for his players at the close of the season. Burris said that would be fine and he could spend $500. Martin, however, instead of throwing the party after the final game in Indianapolis threw it the night before. Burris was surprised to get a call from the Indianapolis GM who couldn't believe that even with the party and possibly hungover players, the Bears still beat his ballclub 11-2.
He also told of how he once asked Paul Richards which pitcher he'd like on the mound if he had to win one game. Richards answer was Car Hubbell.
The night ended too soon but it was great to be among other folks who so enjoy and care about the game.
Friday, November 18, 2005
Apply Now
Earlier this year I wrote an article for THT on "A Day in the Life of a Stringer."
There I discussed what it was like to work for MLB.com inputting data for their Gameday system. In the offseason MLB.com usually lists jobs for stringers and writers on Monster.com and recently published a nice article to promote it and describe some of what it's like to work in that environment.
I didn't have any foul ball experiences quite as interesting as Greg's (the closest was about 10 feet from me) but can vouch for the coolness of the job.
Wednesday, November 16, 2005
Better Late Than...
As you probably already know Major League Baseball and the player's association agreed on a tougher drug policy today. In short the policy goes like this (from the SI story).
Steroid Penalties
- First positive test -- 50-game suspension, up from 10 days.
- Second positive test -- 100-game suspension, up from 30 days.
- Third positive test -- Lifetime ban, with player having right to apply for reinstatement after two years and an arbitrator being able to review reinstatement decision. Under the previous agreement, the earliest a player could be suspended for life was for a fifth positive test.
Amphetamine Penalties (There was no testing for amphetamines in previous agreement)
- First positive test -- Mandatory additional testing.
- Second positive -- 25-game suspension.
- Third positive -- 80-game suspension.
- Fourth positive -- Commissioner's discretion, with an arbitrator being able to review. Testing frequency
What's most interesting about this in my opinion isn't the tougher steroid rules. Those were pretty much a foregone conclusion given that Selig had proposed them in the spring and that congressional action would have resulted had the union not acquiesced.
As an aside Senator Jim Bunning apparently would still like records to be stricken for those who are caught. Although baseball's statistics are more discrete than those in other team sports, the notion that you could somehow make sense of a statistical record where some players records are excised is nonsensical. Bunning has served his purpose in this debacle and it's time for him to sit down and be satisfied that the pressure he tried to apply worked. After all, there is no way the union would have agreed to this or any other policy had the hearing in March not shown how poorly baseball has dealt with the problem.
And speaking of baseball's dismal record, that brings me to the amphetamines penalties. If you think baseball has been tardy on steroids, drugs that have plagued the game for a dozen years or so, widespread amphetamine use in the majors goes back at least 40 years and there has never been any testing or penalties. In fact, Selig himself said in a news conference earlier this year "that he first heard about amphetamines when he walked into the Milwaukee Braves' clubhouse in 1958." Talk about your denial. They were banned in Olympic competition over 35 years ago.
It should be noted that baseball banned the stimulant ephedra after Oriole's pitcher died in 2003 but didn't take the opportunity to add greenies to the list.
One of the ways I've been mourning the end of the baseball season has been to read. And what I picked up to read is Jim Bouton's Ball Four. I bought a paperback copy some years ago at a book sale and always told myself I'd get around to reading it. As most fans know it was Bouton's book that first openly discussed the use of "greenies" by players. Just tonight I ran across this passage:
"At dinner Don Mincher, Marty Pattin, and I discussed greenies. They came up because [John] O'Donoghue had just received a season supply of 500. 'They ought to last about a month',I said.
Mincher was a football player in high school and he said, 'If I had greenies in those days, I'd have been something else.'
'Minch, how many major league ballplayers do you think take greenies?' I asked. 'Half? More?'
'Hell, a lot more than half', he said. 'Just about the whole Baltimore team takes them. Most of the Tigers. Most of the guys on this club. And that's just what I know for sure.'"
Apparently Bunning was asked about the use of greenies in his day (1955-1971) on ESPN radio this morning and he said that he had never seen them in the clubhouse during his playing days. Right.
I find that hard to believe since Bouton, Bill Lee, Dwight Gooden, Tug McGraw, and David Wells have written about their use while Dale Berra and Dave Parker testified that they received amphetamines from Willie Stargell and Bill Madlock. John Milner even testified he got a stimulant from Willie Mays himself.
Long overdue is all I can say.
Tuesday, November 15, 2005
More Errors
Since I posted some data on reaching on errors the other day I thought I'd share the 2003-2005 leaders with 10 or more.
2005                   2004                 2003
Jason Kendall     15   Miguel Tejada   16   Ty Wigginton     15
Freddy Sanchez    13   Ichiro Suzuki   15   Aaron Boone      14
Jose Reyes        12   Albert Pujols   14   Craig Biggio     13
Grady Sizemore    11   Derek Jeter     13   Cristian Guzman  12
Jack Wilson       11   Juan Pierre     13   Miguel Tejada    12
Carlos Beltran    11   Alex Rodriguez  12   Marquis Grissom  11
Derek Jeter       11   Brian Roberts   12   Dave Roberts     11
Chone Figgins     10   Luis Castillo   12   Joe Randa        11
Craig Biggio      10   Mark Loretta    11   Ken Harvey       11
Craig Counsell    10   Carl Crawford   11   Kenny Lofton     10
Adrian Beltre     10   Angel Berroa    11   Jose Vidro       10
Alfonso Soriano   10   Chipper Jones   11   Juan Pierre      10
Gary Sheffield    10   Keith Ginter    10   Ichiro Suzuki    10
Garrett Atkins    10   Jeff Kent       10   Casey Blake      10
Jose Guillen      10   Edgar Renteria  10   Vinny Castilla   10
Johnny Damon      10   Ron Belliard    10   Scott Podsednik  10
Rafael Furcal     10
Willy Taveras     10
NL MVP Shenanigans
I've held off for a long time in discussing the NL MVP race but now that the voting is complete I can go ahead and share my thoughts.
For those who haven't seen it Albert Pujols won with the following vote totals:
       1st 2nd 3rd Total
Pujols  18  14  0   378
Jones   13  17  2   351
Lee      1   1 30   263
Overall I don't have any problem with Pujols winning the award over Derrek Lee. After all, Pujols created 142 runs and totaled 38 win shares while Lee created 144 runs and was credited with 37 win shares. They both play first base and Pujols was 3 runs above average while Lee was 14 over. In Wins Above Replacement Player (WARP) Pujols was at 10.7 while Lee was at 12.3. I also have Lee a couple runs better in baserunning than Pujols.
All told Lee was the better player in terms of creating and preventing runs but Pujols did play on a winning team and that certainly should count for something. Basically, in my view they were close enough to allow the nod to go to Pujols (and because I don't want to upset my friend Jon who is a Cardinals fan).
What everyone is commenting on of course is that Andruw Jones came in second. I'm not even that concerned that he did but that he received 17 second place votes while Lee received just one is a travesty. There simply isn't a rational justification for that result.
Jones came in second for two reasons - 51 homeruns and potential realized. As for the first, in a day and age where there is so much information available for voters it seems strange that as a group they would be caught like a deer in the headlights staring at one number. It's even more inexplicable since that number, in an age of high offensive totals, is relatively low.
More importantly, however, I think many voters and fans generally have had very high expectation of Jones since he made a splash in the 1996 post season. They've expected him to win multiple homerun titles and MVPs and have been at a bit of a loss to explain why he hasn't. Therefore with a great sigh of relief it seemed natural when he made a run this season and so they probably viewed him in a more positive light than his actual contribution would dictate.
Be that as it may, anyway you slice it he simply wasn't the second most valuable player in the league.
Fishing Expeditions
I'd like to thank everyone who gave me feedback on my article on matchups at THT and thought I'd take this opportunity to answer the two most frequently asked questions.
First, several readers pointed out that since I tested over 30,000 outcomes I would expect a certain percentage of those to be in the statistically significant range. In other words, since I expected some low probability outcomes, how can I assign any significance to them in terms of the model not holding? i.e. by concluding that Brian Anderson has some ability to get Garrett Anderson out that the model doesn't capture.
I admit that I didn't catch the issue behind the question immediately but the questioners make an excellent point. Because I was on a "fishing expedition" as the statisticians say I was likely to find some results that were improbable. As a result we can't conclude that the low p-value matchups are necessarily evidence of some ability of a hitter to mash a particular pitcher or a pitcher to flummox a particular hitter. However, I would say that these low p-value matchups are more likely to be those where the model doesn't hold and so a judicious manager could rightly use that data to make pinch hitting decisions.
When statisticians go on a fishing expedition like this they often use a more strict standard of proof rather than the typical p value of .05. One technique to lower the standard is to apply the Bonferroni correction. This simple technique says that if we are testing n outcomes instead of a single outcome, we divide our alpha level by n. So instead of looking at .05 we would look at .05/30,481. What that produces however is a really really small p-value which none of the 30,481 matchups were under. In other words, none would be significant under the most conservative correction. In the battle of the Andersons Garrett would have had to have gone 0-33 against Brian in order to reach this level.
A more liberal application of the Bonferroni correction lowers the p-value to .01 and when that is done there are 133 matchups that fall under this level. Here they are sorted by p-value.
Hitter             Pitcher            AB   H     Avg  HitAvg PitchAvg  ExAvg    p-value
Larry Bigbie       Andy Pettitte      14  11   0.786   0.276   0.247   0.256   0.000051
Garret Anderson    Brian Anderson     22   0   0.000   0.300   0.299   0.335   0.000127
Michael Young      Brandon Backe      10   9   0.900   0.317   0.267   0.318   0.000235
Bill Mueller       Mike Mussina       23   0   0.000   0.303   0.264   0.301   0.000269
Marcus Giles       Jason Schmidt      14  10   0.714   0.305   0.214   0.248   0.000318
Preston Wilson     Jae Seo             6   6   1.000   0.268   0.270   0.271   0.000395
Preston Wilson     Byung-Hyun Kim     10   8   0.800   0.268   0.253   0.254   0.000465
Enrique Wilson     Pedro Martinez     13   8   0.615   0.214   0.219   0.174   0.000465
Jose Reyes         Jon Lieber         13  10   0.769   0.277   0.280   0.292   0.000505
Mark Grudzielanek  Tim Hudson          6   6   1.000   0.304   0.250   0.286   0.000547
Derrek Lee         Mark Mulder        15  11   0.733   0.295   0.266   0.294   0.000558
Matt Holliday      Woody Williams      6   6   1.000   0.299   0.263   0.296   0.000671
Aubrey Huff        Jon Lieber         13  10   0.769   0.290   0.280   0.305   0.000756
Todd Helton        Damian Moss         7   7   1.000   0.343   0.288   0.367   0.000897
Clint Barmes       Odalis Perez       12   9   0.750   0.289   0.259   0.282   0.001022
Reggie Sanders     David Weathers      5   5   1.000   0.272   0.260   0.266   0.001327
David Bell         Gary Majewski       7   6   0.857   0.253   0.264   0.251   0.001365
Charles Johnson    Jake Peavy          6   5   0.833   0.230   0.230   0.197   0.001499
Rondell White      Jake Westbrook     19   0   0.000   0.289   0.265   0.288   0.001588
David Dellucci     Kevin Brown        14   9   0.643   0.242   0.265   0.241   0.001607
Mark Kotsay        Jamie Moyer        21  13   0.619   0.288   0.267   0.288   0.001621
Alfonso Soriano    John Lackey        26   1   0.038   0.280   0.271   0.285   0.001876
Adrian Beltre      Dontrelle Willi     9   7   0.778   0.277   0.254   0.264   0.001923
Brad Wilkerson     Mike Matthews       7   6   0.857   0.257   0.278   0.268   0.001981
Matt LeCroy        Nate Robertson     15  10   0.667   0.273   0.274   0.280   0.002075
Mark Sweeney       Adam Eaton         11   8   0.727   0.277   0.261   0.271   0.002131
Jermaine Dye       Jarrod Washburn    24  13   0.542   0.253   0.266   0.252   0.002278
Aaron Rowand       Tim Wakefield       9   7   0.778   0.288   0.251   0.272   0.002322
David Ortiz        Bartolo Colon      18   0   0.000   0.297   0.255   0.285   0.002385
Jeff Cirillo       Javier Vazquez      6   5   0.833   0.234   0.250   0.218   0.002427
Kevin Millar       Jorge Sosa          9   7   0.778   0.282   0.259   0.274   0.002432
Rocco Baldelli     Jake Westbrook     13   9   0.692   0.285   0.265   0.283   0.002604
Carlos Lee         Jeff Suppan        17   0   0.000   0.287   0.271   0.291   0.002875
Frank Catalanotto  Mike Timlin         7   6   0.857   0.298   0.257   0.288   0.003029
Frank Catalanotto  Dan Wright          5   5   1.000   0.298   0.285   0.318   0.003231
Hideki Matsui      Aaron Sele         14   0   0.000   0.297   0.303   0.336   0.003269
Mike Lowell        Rheal Cormier       6   5   0.833   0.270   0.230   0.234   0.003355
Omar Vizquel       Javier Vazquez     12   8   0.667   0.274   0.250   0.257   0.003376
Bobby Abreu        Mike Hampton       28   2   0.071   0.296   0.273   0.303   0.003453
Ivan Rodriguez     Jon Garland        16   0   0.000   0.303   0.262   0.298   0.003507
Chone Figgins      Esteban Loaiza     11   8   0.727   0.293   0.265   0.292   0.003530
Shane Halter       Eddie Guardado      5   4   0.800   0.213   0.215   0.169   0.003561
Carl Crawford      Mark Buehrle        7   6   0.857   0.293   0.271   0.297   0.003578
Miguel Cabrera     Steve Trachsel     13   9   0.692   0.300   0.263   0.296   0.003686
Orlando Cabrera    Jae-Weong Seo      16  10   0.625   0.274   0.270   0.277   0.003758
Tony Graffanino    Brian Anderson     21   1   0.048   0.281   0.299   0.315   0.003822
Aubrey Huff        Bronson Arroyo     16  10   0.625   0.290   0.254   0.277   0.003826
Frank Catalanotto  Ryan Franklin       7   6   0.857   0.298   0.272   0.304   0.004070
Edgar Renteria     Sean Burnett        5   5   1.000   0.297   0.301   0.334   0.004139
Brian Buchanan     Jason Schmidt       7   5   0.714   0.244   0.214   0.195   0.004176
Edgar Renteria     Gustavo Chacin      9   7   0.778   0.297   0.268   0.299   0.004218
Hideki Matsui      John Parrish       12   8   0.667   0.297   0.238   0.266   0.004280
Kevin Mench        Ryan Franklin      16  10   0.625   0.276   0.272   0.281   0.004284
D'Angelo Jimenez   Brian Anderson      9   7   0.778   0.268   0.299   0.300   0.004306
Jason Bay          Jeff Francis        5   5   1.000   0.295   0.307   0.338   0.004415
Rafael Palmeiro    Orlando Hernand     8   6   0.750   0.261   0.258   0.252   0.004427
Khalil Greene      Dustin Hermanso     6   5   0.833   0.259   0.256   0.249   0.004512
Lew Ford           Rafael Betancou     8   6   0.750   0.285   0.236   0.253   0.004515
Edgar Renteria     Brian Lawrence      9   7   0.778   0.297   0.272   0.304   0.004637
Jack Wilson        Kazuhisa Ishii      8   6   0.750   0.275   0.246   0.254   0.004648
Craig Monroe       Brad Radke         21  12   0.571   0.271   0.276   0.280   0.004808
Eric Chavez        Roy Halladay        8   6   0.750   0.275   0.248   0.256   0.004840
Michael Tucker     Derek Lowe         10   7   0.700   0.254   0.276   0.264   0.004894
Jose Hernandez     Randy Johnson      12   7   0.583   0.241   0.232   0.208   0.004994
Adrian Beltre      Ismael Valdez       7   6   0.857   0.277   0.305   0.317   0.005174
Jonny Gomes        Bartolo Colon       6   5   0.833   0.268   0.255   0.257   0.005274
Mark Loretta       Kirk Rueter        27   3   0.111   0.314   0.298   0.349   0.005321
Brian Roberts      Mike Mussina       26  14   0.538   0.286   0.264   0.283   0.005446
Miguel Tejada      Justin Miller       5   5   1.000   0.298   0.319   0.354   0.005562
Adrian Beltre      Javier Vazquez      6   5   0.833   0.277   0.250   0.260   0.005580
Brad Hawpe         Duaner Sanchez      6   5   0.833   0.259   0.268   0.260   0.005633
Reed Johnson       Johan Santana      12   7   0.583   0.277   0.205   0.214   0.005819
Doug Glanville     Ramon Ortiz         6   5   0.833   0.240   0.291   0.263   0.005865
Geoff Blum         Jeff Suppan        11   7   0.636   0.237   0.271   0.242   0.006177
Tony Clark         Jeff Weaver         6   5   0.833   0.258   0.276   0.267   0.006338
Jimmy Rollins      Salomon Torres      6   5   0.833   0.281   0.254   0.268   0.006427
Jose Guillen       Pedro Martinez     11   7   0.636   0.295   0.219   0.245   0.006643
Jorge Posada       Curt Schilling     13   8   0.615   0.271   0.252   0.256   0.006658
Travis Hafner      Bartolo Colon      15   0   0.000   0.295   0.255   0.284   0.006699
Kevin Millar       Rick Bauer          6   5   0.833   0.282   0.256   0.271   0.006768
Eric Byrnes        John Halama         6   5   0.833   0.260   0.280   0.274   0.007111
Marlon Byrd        Greg Maddux         8   6   0.750   0.271   0.271   0.275   0.007151
Keith Ginter       Juan Cruz           9   6   0.667   0.244   0.257   0.235   0.007267
Pat Burrell        Horacio Ramirez    16   9   0.563   0.249   0.266   0.249   0.007326
Damion Easley      Kevin Millwood      7   5   0.714   0.229   0.257   0.221   0.007326
Eric Chavez        Horacio Ramirez     6   5   0.833   0.275   0.266   0.275   0.007328
Carlos Delgado     Jorge Julio         6   5   0.833   0.292   0.251   0.276   0.007364
Eddie Perez        Randy Johnson       7   5   0.714   0.254   0.232   0.221   0.007378
Gregg Zaun         Jon Garland        11   7   0.636   0.254   0.262   0.249   0.007396
Aramis Ramirez     Garrett Stephen    10   7   0.700   0.296   0.254   0.283   0.007423
Cody McKay         Dan Miceli          5   4   0.800   0.230   0.240   0.206   0.007520
Ichiro Suzuki      Mark Buehrle       19  12   0.632   0.330   0.271   0.334   0.007638
Aramis Ramirez     Tony Armas          6   5   0.833   0.296   0.249   0.278   0.007644
Alex Rodriguez     Jamie Moyer        23  13   0.565   0.302   0.267   0.302   0.007645
A.J. Pierzynski    Mike Mussina        6   5   0.833   0.281   0.264   0.278   0.007692
Alfonso Soriano    Erik Bedard         6   5   0.833   0.280   0.265   0.278   0.007706
Abraham Nunez      Josh Fogg           6   5   0.833   0.256   0.289   0.278   0.007711
Scott Rolen        Brett Myers        10   7   0.700   0.289   0.262   0.285   0.007741
Eric Chavez        Jeff Weaver        10   7   0.700   0.275   0.276   0.285   0.007749
Luis Gonzalez      Jim Brower          8   6   0.750   0.280   0.266   0.280   0.007762
Corey Koskie       Adam Bernero        6   5   0.833   0.266   0.280   0.279   0.007822
Adam Kennedy       Esteban Loaiza      8   6   0.750   0.282   0.265   0.280   0.007877
Edgar Renteria     Rodrigo Lopez      13   0   0.000   0.297   0.279   0.311   0.007885
Rob Mackowiak      Chris Carpenter    20  10   0.500   0.261   0.237   0.231   0.007902
Carlos Lee         Brian Anderson     33   4   0.121   0.287   0.299   0.320   0.007963
Adrian Beltre      Jae-Weong Seo       6   5   0.833   0.277   0.270   0.280   0.007975
Paul Konerko       John Halama         6   5   0.833   0.267   0.280   0.281   0.008061
Antonio Perez      Jason Schmidt       7   5   0.714   0.280   0.214   0.226   0.008093
Mark Bellhorn      Jose Contreras      5   4   0.800   0.239   0.236   0.210   0.008115
Russell Branyan    Kip Wells           7   5   0.714   0.237   0.255   0.226   0.008180
Rod Barajas        Bartolo Colon      18   0   0.000   0.244   0.255   0.234   0.008328
Jim Edmonds        Jason Jennings     13   0   0.000   0.280   0.293   0.308   0.008382
David Newhan       Jon Lieber          6   5   0.833   0.271   0.280   0.285   0.008564
Craig Counsell     Scott Linebrink     5   4   0.800   0.246   0.232   0.214   0.008624
Carlos Zambrano    Chris Carpenter     7   5   0.714   0.258   0.237   0.229   0.008638
Geoff Jenkins      Tim Redding        14   9   0.643   0.283   0.285   0.302   0.008699
Miguel Olivo       Ted Lilly           5   4   0.800   0.229   0.249   0.214   0.008702
Xavier Nady        Kerry Wood          5   4   0.800   0.262   0.219   0.215   0.008885
Alfonso Soriano    Kevin Brown        15   9   0.600   0.280   0.265   0.278   0.008916
Pat Burrell        Aaron Cook          8   6   0.750   0.249   0.306   0.287   0.008929
Royce Clayton      Rick White          6   5   0.833   0.260   0.294   0.288   0.009009
Fernando Vina      Matt Clement        5   4   0.800   0.243   0.239   0.217   0.009213
J.T. Snow          Kevin Brown         6   5   0.833   0.291   0.265   0.289   0.009247
Kevin Millar       Scot Shields        9   6   0.667   0.282   0.232   0.246   0.009283
Juan Pierre        Roy Oswalt         10   7   0.700   0.303   0.258   0.294   0.009315
Richard Hidalgo    Mike Mussina       11   7   0.636   0.262   0.264   0.259   0.009398
Ramon Martinez     Scott Linebrink     7   5   0.714   0.268   0.232   0.233   0.009438
Miguel Cabrera     Adam Eaton         10   7   0.700   0.300   0.261   0.294   0.009463
Casey Blake        Wade Miller         7   5   0.714   0.257   0.244   0.235   0.009794
Brad Ausmus        Mike Remlinger      5   4   0.800   0.244   0.242   0.221   0.009841
Phil Nevin         Darren Oliver       6   5   0.833   0.270   0.290   0.293   0.009866
John Mabry         Brandon Webb        7   5   0.714   0.258   0.244   0.236   0.009882
Mark Teixeira      Aaron Sele         12   0   0.000   0.282   0.303   0.319   0.009886
Once again we can never say for sure that these are statistically significant (e.g. they represent something not represented by the model) but they are much more likely to be so.
The second question was related to why I thought that certain pitchers did well againt certain pitchers and vice versa. This question sprang from the realization that Brian Anderson made the top 25 list in the article for lowest hit matchups three times, once each with Garrett Anderson, Tony Graffanino, and Carlos Lee. At first glance one might think it had something to do with platoon effects but of course neither Lee nor Graffanino bat left-handed. Any in any case Anderson doesn't have large split differences (.282/.325/.484 vs lefties the last three years and .304/.341/.510 vs righties).
If indeed these matchups are significant it tells me that Anderson likely has something in his delivery that gives certain hitters trouble. For example, his arm angle may be difficult for some hitters to pick up. Or there may be something in his repertoire might be hard for hitters who hit certain pitches well to deal with. I looked at all of Anderson's matchups (116 or so) and didn't really see much of a pattern that I could discern and so I'm still somewhat at a loss to explain it if indeed it isn't simply randomness.
If anyone has better ideas I'm all ears.
Monday, November 14, 2005
Reaching on Error
Awhile back I wrote a post about Willie Wilson and reaching on errors. There I called into question John Miller's recollection that Bill James once wrote that Wilson had reached base on errors 31 times in a season. I doubted the statement since the most I could find in the period 2000-2004 was 16 by Miguel Tejada in 2004.
Well, I've now loaded all 3.7 million records of play by play data for 1970-1992 and ran the following query to see who had reached base the most on errors in individual seasons. The winners with 15 or more ROEs in the period were...
1985    Wally Backman         26
1985    Bob Meacham           26
1987    Wally Backman         22
1986    Willie McGee          21
1977    Bert Campaneris       20
1979    Jack Clark            20
1986    Carney Lansford       20
1984    Al Wiggins            20
1990    Mariano Duncan        20
1975    Dave Cash             19
1974    Lou Brock             18
1973    Pete Rose             18
1975    Thurman Munson        18
1975    Claudell Washington   18
1982    Garry Templeton       18
1985    Dan Gladden           18
1986    Dan Gladden           18
1982    Rafael Ramirez        17
1983    Garry Templeton       17
1975    Ralph Garr            17
1977    Bill Almon            17
1979    Al Cowens             17
1973    Mickey Stanley        17
1971    Cesar Tovar           17
1984    Steve Sax             17
1991    Cal Ripken            17
1970    Mickey Stanley        16
1971    Sandy Alomar          16
1974    Larry Bowa            16
1972    Don Money             16
1978    Larry Bowa            16
1976    Bill Russell          16
1982    Pedro Guerrero        16
1980    Willie Wilson         16
1989    Dan Gladden           16
1985    Mariano Duncan        16
1986    Mariano Duncan        16
1988    Dan Gladden           16
1989    Roberto Alomar        16
1982    Paul Molitor          15
1983    John Castino          15
1983    Tim Wallach           15
1984    Julio Franco          15
1983    Ryne Sandberg         15
1977    Gary Matthews         15
1977    Amos Otis             15
1975    Felix Millan          15
1975    Manny Trillo          15
1973    Tommy Harper          15
1975    Bucky Dent            15
1974    Len Randle            15
1974    Rennie Stennett       15
1970    Aurelio Rodriguez     15
1986    Bob Horner            15
1985    Tom Herr              15
1985    Glenn Hubbard         15
1984    Ryne Sandberg         15
1989    Ricky Jordan          15
1990    Shawon Dunston        15
1990    Joe Carter            15
What I get out of this list is that reaching on errors contains both a component of speed as the list is dominated by speedsters but also an element of luck (Larry Bowa made the list twice after all) mixed with right handed hitters who pulled the ball in the hole (Horner, Carter, Clark, Guerrero). Dan Gladden makes the list four times (85,86,88,89).
You'll also notice that Wilson's best season was 1980 when he reached 16 times on errors.
Saturday, November 12, 2005
The Young Sabermetrician
While leafing through some old papers at my parents house last summer I came across a blue binder that contained roughly 20 pages of green bar paper filled with dot-matrix printing. Upon further inspection the binder contained my first sabermetric "studies" from the winter of 1982-1983 when I was a wee-lad of 14. While a detour into the mind of a 14-year old might not sound very instructive, looking at these studies reminded me of several concepts I later learned about baseball statistics and so since you obviously have nothing better to do, I thought I'd share some of those with you today.
The studies were performed with the help of an Osborne 1 personal computer that my Dad had purchased the winter before. The Osborne was released in April of 1981 and included 64K of RAM, a 5" screen (we subsequently purchased a 14" orange screen monitor), two 91K disk drives, and the CP/M operating system. It was the first "portable" computer and the keyboard could be attached to the CPU so that the it would pack up like a very heavy and bulky suitcase.
I remember vividly that while in the "showroom" in the winter of 1981 my Dad asked the salesman about the differences between the Osborne and the new IBM PC and its DOS operating system. The slick salesman assured my Dad that CP/M was the way to go and that Osborne would be around for a long time. Well, that didn't really work out but that Osborne did come with a spreadsheet (SuperCalc), Wordstar, Microsoft MBASIC, and Dbase II. It was SuperCalc and Dbase II that I used extensively in my baseball research.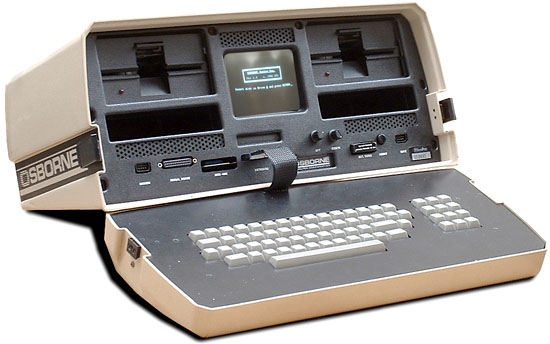
My other tools I used in the studies were my first Baseball Encyclopedia that I purchase around this time and which sits proudly on my shelf next to the desk at which I'm typing, and the book Daguerreotypes which was published by the Sporting News and was a register of I believe Hall of Fame players.
That winter I joined SABR and promptly let my membership lapse as girls and other pursuits caught my attention. I came to my senses and rejoined in 2003.
I didn't read my first Baseball Abstract until 1984 although I must have run across some of Bill James' writing since I see Runs Created mentioned in one of the studies. I'm sure you're all dying to find out just what a 14 year-old in the bad old days before the internet (we did have a 300 baud modem that fit into the floppy drive slot and from which we could dial long distance into bulletin boards with lots of crappy software) could have possibly written about.
So in looking through the binder here were the studies, my sometimes strange conclusions, and what I was missing:
What I reported was that NL pitchers who had pitched 200 innings or more in 1971 went on to pitch 6.18 more years while AL pitchers who pitched 200 innings or more in 1972 had careers 5.24 years longer. I was no doubt pleased to report that the DH shortened the careers of pitchers by almost a year. Of course I wasn't really aware of the dangers of small sample size and so my study included only 25 AL pitchers and 22 NL pitchers and I made no allowance for pitchers changing leagues. In the end, I have no idea whether the DH did shorten careers but I'm pretty sure this study wouldn't have found it if it did.
My results were HR - 3.52, BA - 3.43, FA - 3.19, ERA - 2.62, SB - 4.43. I'm not sure what if anything I concluded from this as the rest of the page is blank, but of course this study was flawed since park effects weren't taken into account and because the sample size was small including only World Champions - not to mention the fact that the winner of the World Series is not the best team in baseball a majority of the time.
In any case the data shows that Veterans Stadium increased runs by 20.6% while Dodger Stadium depressed runs by 13%. Other hitters parks were Riverfront, 3 Rivers, and Fulton Country Stadium. Once again I probably looked only at a single year and I now know that park factors, while useful, fluctuate wildly from year to year. They should be calculated over a three or five year time period and then be regressed to the mean.
I also noted that the Western division as a whole went 265-323 against the East. For good measure I included the Royals' starters totals and showed they performed better against the West than the East as well. My conclusion: "...all I can say is that my friend who asked me this question should know what he's talking about before he starts talking." Not well written but I can't argue with the conclusion (at least for 1982).
Right handed hitter vs. left handed pitcher: .209
Right handed hitter vs. right handed pitcher: .333
Left handed hitter vs. left handed pitcher: .289
Right handed hitter vs. left handed pitcher: .303
My conclusion was that announcers are wrong when they talk about a general platoon advantage and any differences probably have more to do with the individual and how much "practice" they get against each side. Well, my sample size here was really small with left vs. left at only 38 at bats and right vs. left with only 115 at bats and so the results are obviously meaningless. In fact, the batting average over the entire sample was .300. The other problem, of course, is that the sample was taken probably almost exclusively from Cubs games, those being the only games that we were regularly able to watch in eastern Iowa at the time.
Using retrosheet data here are the actual splits for the 1982 season:
Bats   Throws      PA     AVG   OBP    SLUG
R      R        59110   0.255  0.305  0.381
L      R        38048   0.270  0.329  0.405
B      R        15403   0.263  0.317  0.367
L      L        11078   0.253  0.312  0.362
B      L         6799   0.250  0.294  0.350
R      L        30666   0.268  0.321  0.413
This study brings to mind the article "Underestimating the Fog" that Bill James wrote for the Baseball Research Journal last spring and that stirred the waters of the sabermetric community a bit. In that article James criticizes the common technique employed in various sabermetric studies that are typically cited to "prove" conclusions - for example James' own look at platoon differentials in the 1988 Baseball Abstract. That technique involves the search for recurrence or persistence of the phenomena being studied using year to year correlations. In other words, James did a study that attempted to determine if platoon differentials persisted across seasons. He found that they did not for individual players and so concluded that hitters have no individual ability to hit well or poorly against left-handed pitching but that there is a strong group tendency to do so.
James then argues that in this cases as in others the negative conclusion - the phenomena is not real - is flawed because there is too much instability in the data used to make the conclusion. For example, the conclusion that there is no specific ability to hit well or poorly against left-handed pitching is based on platoon differentials where the number of plate appearances against left-handed pitchers is around 120 in a season. The randomness involved in such a small sample size tends to swamp the differential itself, thereby making the results meaningless.
While the number of at bats in each count wasn't large, these results were more significant because of the big differences between the various accounts and track pretty nicely with a more recent query I ran on counts for 2004. What I was missing in this analysis is the effect of strikeouts. On several of the pitcher's pitches (0-2,1-2,2-2, 3-2) the batter has the chance of striking out whereas on hitter's counts a swing and miss or a pitch taken for a strike doesn't depress the batting average. By taking the strikeouts out of the picture what you learn is that while batting average is generally lower in pitcher's counts, it is the slugging percentage that suffers most. In other words, as common sense would dictate, with two strikes hitters often sacrifice power at the expense of average as they look to protect the strike zone and the put the ball in play.
To compute this rating I assigned weights to nine different offensive categories as follows:
Single      275
Double      350
Triple      400
Homerun     500
Stolen Base 250
Run         375
Walk        235
Strikeout  -275
RBI         425
I used as my sample all of the players in the book Daguerreotypes and included the recently retired Willie Stargell, Bobby Bonds, and Reggie Smith. To calculate the rating I then divided the career totals in each of the nine categories by the player's number of at bats and then multiplied this rate by the weight. After adding up each of the weighted values I then ranked the players by this rating. For players whose statistics were incomplete I projected their career totals using the rate for that part of their career for which data was present.
This study was carried out using Dbase II and I remember painstakingly typing in the statistics for the approximately 275 players in the book. The exercise of performing the calculations did force me to learn the Dbase programming language, which of course had a pretty long shelf life and which I used in a college job doing FoxBase programming at Iowa State University. I know you're dying to see who really were the greatest offensive players of all time so...
Babe Ruth      346.0
Ted William    342.1
Lou Gehrig     329.5
Billy Hamilton 316.6
John McGraw    306.2
Joe DiMaggio   293.5
Jimmy Foxx     291.8
Ed Delahanty   291.4
Ty Cobb        290.0
Sam Thompson   289.7
As you can see from the list the rating is biased towards players who played before 1901 with four making the list. I also produced a list of post 1900 leaders that went like so:
Babe Ruth      346.0
Ted William    342.1
Lou Gehrig     329.5
Joe DiMaggio   293.5
Jimmy Foxx     291.8
Ty Cobb        290.0
Hank Greenberg 287.7
Rogers Hornsby 280.4
Mel Ott        276.7
Tris Speaker   274.6
Here players who played prior to 1950 are given the nod.
Obviously there are many things wrong with this system not the least of which is that the weightings of the events are out of whack. The weights given to stolen bases, singles, doubles, and triples at the expense of homeruns and walks allows players from the 1800s and those in the deadball era to do well. Players from the 1950s and later are hurt even more by the -275 assigned to strikeouts - a weight that is equivalent to singles and greater than walks and that is wildly inaccurate. Simply put, strikeouts don't matter that much in the big scheme of things. One of the side bars in the book Mind Game makes the point well by showing that team strikeouts have little effect on total runs scored. The same can be said of stolen bases - a weapon that is strategic in nature.
In addition you'll also see that the weighting of runs scored and RBIs is out of whack since other systems don't take these into account at all. The reason is that they are highly dependent on the team context in which the player finds himself.
I've written a bit about the history of creating weights for offensive elements in a series of article on run estimation last year at this time.
- A Brief History of Run Estimation, Part I
- Run Estimation: Runs Created
- Run Estimation: Batting Runs
- Run Estimation: Estimated Runs Produced
- Run Estimation: Base Runs
Outside of the event weights the system suffers from a lack of context as well. You simply can't compare the raw offensive totals of players from different eras because the run environments in which they played differs. Hitting .400 in the 1930s is not the same thing as doing it in the 1960s as illustrated in this graph that shows the runs per game since 1901.
The same can be said of the park in which they played as mentioned previously. As a result the stats would have had to have been adjusted for the context before making comparisons. From an offensive perspective Michael Schell has taken the approach to its highest level in his books Baseball's All-Time Best Hitters and Baseball's All-Time Best Sluggers : Adjusted Batting Performance from Strikeouts to Home Runs.
Reading through these studies it became clear to me how much my thinking about baseball has been influenced by the writing of Bill James, Craig Wright, and Pete Palmer among others. Given the rise of personal computers and the information revolution, however, the kind of analysis they brought to the table was destined to occur. And that kind of analysis is now breeding a new way for teams to draft, shape their roster, and evaluate their talent.
Thursday, November 10, 2005
Searching for Significance
My article looking at matchup data for 2003 through 2005 is up on THT today. The article looks at the 30,481 batter/pitcher matchups during that time period in order to take a look at which ones are statistically signficant and make some general observations about matchups.
Although it didn't come out prominately enough in the article Lawrence Weintraub (who is in astrophysics at CalTech and has been up each night waiting for the clouds to part), and John Walsh really helped me work through the issues surrounding the results I was getting and so I'd like to more publicly thank them. John will also have some very interesting articles published on THT in the coming days.
Wednesday, November 09, 2005
Palocracy
Well, the offseason has certainly gotten off to a roaring start. With seven teams changing GMs and the soap opera like stories around Theo Epstein in Boston, Paul DePodesta in Los Angeles, Pat Gillick in Philadelphia, Josh Byrnes in Arizona, and Gary Hunsaker in Tampa Bay (although not officially a GM), there's lots for the baseball fan to take note of.
The number of changes at the top has resulted in lots of discussion about the increasing notoriety, celebrity, and importance of GMs in the modern game. David Pinto had a nice post on the subject titled GM Stock last week. Pinto argues that free agency and the information revolution have had much to do with innovation in baseball being pushed up the ladder to the GM and away from the managers on the field. That trend has been accelerated by the debate that Moneyball started between the old school and the new.
I would also add that the amount of money now at stake in the game has upped the ante for the owners. That has led to owners who treat their teams more as investments and less as play things where efficient and innovative practices are sought out. And that brings us to the culture of baseball.
Last weekend I was re-reading Men At Work: The Craft of Baseball by George Will published in 1990, and ran across a passage that does a great job of painting the picture of baseball's management culture as it existed before the information revolution had made much of an impact and even as it exists in some places still today.
"To the familiar classifications of social systems, now add a new category to cover the peculiar governance of baseball. To aristocracy, plutocracy and democracy add baseball's contribution to government: 'palocracy,' government by old pals. Baseball has traditionally been run by men whose lives have been intersecting and entwined for decades. They have known one another from the rocky playing fields and spartan offices of the low minor leagues all the way up to the manicured playing fields and well-appointed suites of the major leagues. You do not talk long with a baseball person you hear the phrase 'baseball person.' Often it is accompanied by a negative: So-and-so is 'not a baseball person.' No adjective is required, thank you very much. A baseball person is a good baseball person. A palocracy can make for kinder, gentler governance, but it also can make the world safe for mediocrity..."
"Closed systems, such as tenured university faculties or diplomatic corps or military services, are vulnerable to systemic mediocrity. People who have gone to the same schools, climbed the same career ladders, absorbed the same values and assumptions and expectations, become intellectually insular and professionally self-protective. They forgive one another their mistakes, and mediocrity becomes cozy."
One of the effects of the larger role of GMs and the Moneyball debate has been to start to break the palocracy and replace it with a meritocracy that uses all of the tools available to build a winning team. And that is very good for baseball.
Call the Feds
Here's a post that nicely sums up my feeling on the Neifi Perez two year $5M contract.
I've said it before and I'll say it again, you can't give Dusty Baker more than one good field, no hit infielder since he really really really likes to bat them at the top of the order and have them sacrifice willy nilly. I'm sorry but that means that Joe Macias must be transferred into the witness protection program immediately.
Tuesday, November 08, 2005
Third Base Crossroads
My fellow writer Steve Treder at THT has written a very interestinge piece on third base as a crossroads position of sorts. Although I've written about the changing importance of defensive skills at the position over the years, Steve argues that third base sitting in the middle of the defensive spectrum as it does has consequences:
"...third base is simultaneously easier to play than half of the positions and harder to play than the other half. This makes third base a position that one half of the roster can aspire to as the highest challenge of their skills, as well as a position that the other half of the roster can relax toward as their skills erode due to age or injury. To be played well, third base demands the strong arm and quick reflexes of more difficult positions, but third base can also be played passably by the slow-footed players generally found in the easier positions."
The consequence of this is that third base is viewed as transitional by most teams, which has an impact on the architecture of their rosters.
"...a very high proportion of players are likely to spend at least some time playing third base. This high degree of potential traffic passing through third base—its Crossroads status—has the consequence of causing many teams to plan for third as a transitional position, to leverage its capacity to maximize roster flexibility. It often makes sense for teams to not concern themselves with finding and settling on a long-term answer at third base, thus reducing the opportunity for players to pursue full careers as third base specialists..."
The result of the way third base viewed is worked out in the fact that there are fewer "no doubt" Hall of Famers at third base, just eight, than there are at any other position. It also is a reason that a seeming majority of teams like the Cubs (where there is even a name for the phenomenon - "the curse of Ron Santo"), White Sox, and Yankees have struggled finding a third baseman that could man the position for more than a year or two. Great stuff Steve.
Saturday, November 05, 2005
Fun with Matchups
Question: How often do particular hitters face paritcular pitchers in a season?
To answer that question I took a look at matchup data for 2003 through 2005. The following list are those hitters with the most at bats against a particular pitchers over that time period.
I've also included the hitter's average over the period, the pitcher's average against as well as the expected average for the matchup based on the log5 method that Bill James published in the 1983 Baseball Abstract. Dan Levitt has written a nice article on the formula and its accurracy.
So from the table you can see that around 15-20 at bats per season are probably the max.
Batter              Pitcher               AB       H     AVG    BAVG    PAVG   ExAVg
Garret Anderson     Jamie Moyer           45      10   0.222   0.300   0.267   0.300
Juan Pierre         Livan Hernandez       43      13   0.302   0.303   0.262   0.297
Carl Crawford       Tim Wakefield         42      15   0.357   0.293   0.251   0.277
Michael Young       Barry Zito            41       9   0.220   0.317   0.234   0.281
Ray Durham          Brian Lawrence        41      14   0.341   0.286   0.272   0.292
Angel Berroa        Mike Maroth           41      15   0.366   0.273   0.292   0.299
Derek Jeter         Tim Wakefield         40       9   0.225   0.307   0.251   0.291
Garret Anderson     Ryan Franklin         40      13   0.325   0.300   0.272   0.306
Ichiro Suzuki       Barry Zito            40      14   0.350   0.330   0.234   0.293
Derek Jeter         Rodrigo Lopez         40      19   0.475   0.307   0.279   0.321
Miguel Cabrera      Livan Hernandez       39       8   0.205   0.300   0.262   0.295
Jimmy Rollins       Dontrelle Willis      39       9   0.231   0.281   0.254   0.268
Manny Ramirez       Rodrigo Lopez         39      12   0.308   0.309   0.279   0.323
Juan Encarnacion    Livan Hernandez       39      15   0.385   0.265   0.262   0.260
Ray Durham          Jake Peavy            38       6   0.158   0.286   0.230   0.248
Luis Castillo       Livan Hernandez       38       9   0.237   0.302   0.262   0.297
Manny Ramirez       Roy Halladay          38       9   0.237   0.309   0.248   0.288
Juan Pierre         Tom Glavine           38      11   0.289   0.303   0.272   0.309
Luis Gonzalez       Jason Schmidt         38       8   0.211   0.280   0.214   0.226
Torii Hunter        Mark Buehrle          38      11   0.289   0.262   0.271   0.266
Michael Young       John Lackey           38      15   0.395   0.317   0.271   0.322
David Ortiz         Roy Halladay          38      14   0.368   0.297   0.248   0.277
Mark Kotsay         Ryan Franklin         37       9   0.243   0.288   0.272   0.294
Cesar Izturis       Brett Tomko           37       9   0.243   0.267   0.281   0.282
Johnny Damon        Roy Halladay          37      13   0.351   0.298   0.248   0.278
Carl Crawford       Josh Towers           37      15   0.405   0.293   0.290   0.317
Eric Chavez         Kenny Rogers          36       7   0.194   0.275   0.285   0.295
Ichiro Suzuki       John Lackey           36      11   0.306   0.330   0.271   0.335
Johnny Damon        Rodrigo Lopez         36      11   0.306   0.298   0.279   0.312
Michael Young       Joel Pineiro          36      13   0.361   0.317   0.268   0.319
Eric Chavez         Ryan Franklin         36      12   0.333   0.275   0.272   0.281
Derek Jeter         Sidney Ponson         36      16   0.444   0.307   0.294   0.336
Hank Blalock        Joel Pineiro          35       5   0.143   0.279   0.268   0.281
Hideki Matsui       Tim Wakefield         35       6   0.171   0.297   0.251   0.281
Cesar Izturis       Adam Eaton            35       8   0.229   0.267   0.261   0.262
Michael Young       Bartolo Colon         35      11   0.314   0.317   0.255   0.304
Shannon Stewart     Jake Westbrook        35      11   0.314   0.294   0.265   0.293
Juan Pierre         Mike Hampton          35      12   0.343   0.303   0.273   0.310
Alex Cintron        Jason Schmidt         35       9   0.257   0.283   0.214   0.229
Shawn Green         Jake Peavy            35      10   0.286   0.277   0.230   0.240
Jacque Jones        Jon Garland           35      12   0.343   0.268   0.262   0.264
Lew Ford            Mark Buehrle          35      13   0.371   0.285   0.271   0.289
Brad Wilkerson      Tom Glavine           35      14   0.400   0.257   0.272   0.262
Wednesday, November 02, 2005
Will and Schwarz
Just wanted to mention that my review of BP's new book Mind Game is up on the THT site today.
I was also pleased to find a piece on Baseball America (subscription side) from two of my favorite writers, an interview Alan Schwarz did with George Will. In the intro to the interview Schwarz notes that Will's Men At Work (perhaps my favorite baseball book) is the best selling baseball book of all time.
While the interview is worth the read (and an online subscription to BA is also worth it) my favorite exchange, and one I empathize with, was this one about Will's past as a long suffering Cubs fan.
AS: What has been the worst moment for you as a Cubs fan?
GW: Losing Game Six of the Marlins playoff in 2003--the Bartman Game. Game Seven was an afterthought. The man who should love Bartman and put him in his will is the Cubs' shortstop--Alex Gonzalez. No one remembers that Gonzalez dropped a double-play groundball the same inning. I remember walking out of Wrigley Field and someone saying, "Mr. Will, we'll get 'em tomorrow." I said, "not a chance."
I remember the 1984 playoffs with the Padres. The Cubs had won the first two games, and Don Drysdale was broadcasting for ABC at the time. I'm walking out of Wrigley field next to him and he says, "All right, Will, now do you believe?" and I said, "Every Cub fan knows it's the Padres in five." Which of course it was.
After game six in 2003 I had exactly the same feeling throughout the day of game 7. I allowed my hopes to rekindle when Moises Alou hit his two-run homer in the 3rd inning to give the Cubs a 5-3 lead but I should have known better.
Will's mention of Alex Gonzales is another example of the "but for this..." canonical story in action that I wrote about last week on THT. The Bartman play becomes the fulcrum on which the series tipped while the Gonzales play is lost because of our propsensity to simplify the story in order to fit our model. I wouldn't be surprised if 20 years from now folks will forget there was a game 7 at all.
I also found interesting Will's analysis of the 2005 post season (the interview was done just as the playoffs were beginning).
GW: I may annoy people, but my reasonably longshot bet--which is the only kind worth making--is to look out for Houston in the postseason, because they've got Clemens, Pettitte and Oswalt....Jerry Reinsdorf has been a very good baseball owner and cares passionately about it. Some people think that all he cares about are the Bulls. He really wants to win in the American League and I'd like to see him get a chance. That's an exciting team.
Tuesday, November 01, 2005
Esptein Walks
Another blow for the performance analysis crowd as Theo Epstein does not re-sign with the Red Sox as their GM. However, rather than being thrown out it appears Epstein left because he felt his relationship with CEO Larry Lucchino was compromised and so he walked away. You can read his statement here.
Earlier reports I'd seen said money was at issue as well although at the end he appeared to be able to get his $1-1.5M per year. Of course that makes him the most marketable general manager out there and who knows, he may have gotten some information on another job opening up or be interested in the Dodgers, Phillies, or Tampa Bay jobs. It's surprising to me that the Sox would mess around with this and didn't get the deal done sooner. And of course this will be another interesting situation to watch as the new GM will have decisions to make on Johnny Damon, David Wells, and the perennial off season attempted trade of Manny Ramirez.
Fallout from this could very well include the cadre of analysis gurus the Red Sox employ including Bill James and Voros McCraken. There could be two more free agents in the making.
125x125_10off+copy.jpg)


