
This morning was an entertaining one at the convention. After a good breakfast I had the opportunity to sit in on the Science of Baseball Committee meeting. Alan Nathan, whom I mentioned in a post yesterday, is the chair and introduced guest Mike Marshall. Marshall of course won a Cy Young with the Dodgers in 1974 having pitched 208.3 innings pitching in 106 games and winning 15 games and saving 21. He went on to get his Ph.D. in kinesiology.
Marshall is an interesting fellow and has a unique theory on pitching mechanics. It is his contention that in order to avoid injury pitchers should pronate their release - in other words face the thumb downward and the palm upwards upon release of the ball. By doing so he claims that it will put much less stress on the elbow by not "banging" it and thereby prevent injuries. He has specific ways he claims pitchers should be throwing fastballs, curves, and even screwballs that he claims will not hurt your arm and even provide more than twice the rotation on the curveball as the traditional method. He showed a bit of his instructional video that illustrates Jeff Sparks use of Marshall's techniques which, along with his book and FAQ, you can get from his web site at http://drmikemarshall.com/. He was very confident and seemed like a man on a mission.
Unfortunately for Marshall he's not taken seriously in the general baseball community and his ideas haven't taken hold. I'm certainly not qualified to judge either way but the motion he described seemed very difficult to execute and I understand that Will Carroll has a critique of Marshall's approach in the book Saving the Pitcher that you might want to check out.
After the meeting it was time for the panel discussion with members of the Seattle Pilots. Steve Hovley, Jim Pagliaroni, Marshall, and Jim Bouton participated with Jim Caple from ESPN as the moderator. The memories of the players about Seattle, Sicks Stadium, their manager "pound the ol' Budweiser" Joe Schulz and other teammates were very entertaining and kept the overflow crowd laughing. The Q&A was also handled well and I found Pagliaroni especially insightful in his relating his time as the player rep for the Pirates in the mid 60s and his story of how he idolized Ted Williams which prompted him signing with the Red Sox out of high school. He was also the on deck hitter when Williams hit his final homerun at Fenway park and related how emotional he became and how he was able to shake Williams' hand when he crossed the plate.
Of course many of the question surrounded Ball Four and Bouton's life afterwards. Hovley appeared to be not especially interested in answering questions but the rest seemed genuinely pleased to be associated with the Pilots.
After the panel Bouton signed autographs for all interested and I purchased an updated Ball Four (my copy is a beat up paperback from around 1971 that I purchased second hand of course) which he graciously signed with the line "Smoke 'em Inside". Before heading back to my room I was able to finally meet Cyril Morong whose work I've long admired as well as Roland Hemond, the former Angels farm director and White Sox executive, who told a funny story about Dick Allen and Chuck Tanner to those gathered around.
Currently, there is a panel of SABR founders going on where they're relating the founding of SABR by 16 folks on August 10, 1971.
Friday, June 30, 2006
SABR36 Day 3
Thursday, June 29, 2006
SABR36 Day 2: Afternoon and Evening
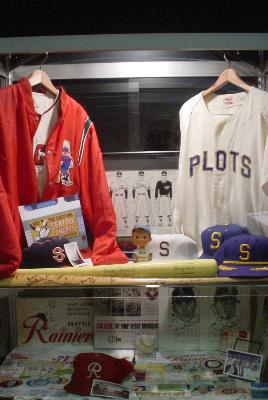
Well, after taking a look at the fine display of northwest baseball history and perusing for more books, I took in four more talks in the afternoon.
First up was Vince Gennero who has done some fascinating analysis in quantifying the dollar value of a player to a team, work which he talked about in his articles earlier this year on The Hardball Times. In epitome Vince found that the there is a significant variation in the value of a win by market and team and that as you might imagine generally speaking the wins from 70 to 98 have the largest impact on revenue and the value of a player to a particular team.
I then wandered over and listened to Bill Gilbert discuss the ins and outs of salary arbitration. Gilbert has worked for Tal Smith on the arbitration process and attended 15 or so hearings over the years. He views the system as essentially a positive and constructive one for both sides and noted (using a real overhead projector and transparencies I might add) that the use of arbitration has steadily declined over time to the point where just 6 cases went to a hearing in 2006. The winning percentage of the players has also decreased over the years as well.
1980-1992    45%
1993-2001    37%
2002-2006    31%
What I found interesting was how he illustrated the process by using the salary history of B.J. Ryan, Washburn, and Michael Barrett and showed how a player's salary can go down by being non-tendered as Barrett was in the 2003-2004 off season. He also noted that about half the cases are settled right at the midpoint with the majority of the remainder settled below the midpoint. Gilbert was also quick to point out that although arbitration can often be a painful process for the player, at least on the cases he's been a part of, management goes to great pains to try and make their case without demeaning the player.
In between sessions I was able to meet Aaron Gleeman, Steve Treder, Jay Jaffe and Chris Jaffe among others whose writing and work I appreciate.
From there I took in Mike Carminati's (of Mike's Baseball Rants) presentation on the history and impact of relievers. The talk was quite comprehensive and included more data than you can shake a stick at compressed in the 30 minute format allowed for speakers. In the end he concludes that Hoyt Wilhelm, Mariano Rivera, and Goose Gossage were the best relievers of all time in terms of saving runs. He also had some recommendations based on his analysis on how to change the save rule and to consider some relievers of the past for possible Hall of Fame induction. Interestingly, he also contends that the modern reliever was born on August 19, 1978 when Bruce Sutter gave up six earned runs in 2.7 innings and from that point to the rest of the season was ineffective. The next season he was used in a closer role albeit one not as restrictive as the post-modern closer role ushered in by Dennis Eckersley and Tony LaRussa in the late 1980s.
Finally, Phil Birnbaum the editor of SABR's By the Numbers newsletter had a nice presentation on how players perform in their free agent year. In the end he concluded that statistically speaking there is no evidence that a player entering their contract year performs differently than they would be expected to based on their previous and future performance using an algorithm Phil developed for his talk last year on luck.
Oh, and Maury Brown did a fine job on his talk on the upcoming CBA while I waited in the wings to address questions related to the competitive balance study I did earlier this year for The Hardball Times.
After the talks were done we headed down to a store near Pioneer Square called Ebbet's Field Flannels where they make vintage jerseys and caps from the minor and negro leagues and over to Elliott Bay Books where several authors including Jeff Angus and Rob Neyer were discussing and signing books.
It was a great day and am looking forward to tomorrow with the Pilots panel, more committee meetings, and the Rockies/Mariners games.
SABR36 Day 2: Continued
To round out the morning I sat in the Bio Project committee meeting before heading up to view the poster presentations (and meeting Alan Reifman who has a nice poster on improbable events of the past few years) and browse the vendor room loaded with baseball books and memorabilia. A few interesting facts from the bio committee included the fact that there are 365 completed bios, 743 assigned, and 345 members on the committee. Considering that there are over 16,000 players for which biographies are needed and that the number of players entering the league exceeds the completion rate for these biographies, you'll see that the task ahead is a daunting one.
To begin the afternoon I attended a talk by physics professor Alan M. Nathan titled "Baseball Aerodynamics: What do we know and how do we know it?" Nathan reviewed the effects of so-called magnus force (lift and drag) on a batted ball which should be familiar to those who've read The Physics of Baseball and reiterated that the optimally hit homerun will be hit with an angle of around 35 degrees and not the theoretical optimum of 45 degrees because of the backspin placed on the ball through the effect of undercutting the ball with the swing.
He then discussed how the measurements are made including wind tunnel and video tracking of trajectory – experiments which Nathan detailed. It turns out that there is disagreement in the academic community regarding the "drag crisis" which has an effect on the predictions one would make in terms of batted ball distance. However, he was optimistic that with new technology like he's been using that and other questions will be able to be resolved.
After Nathan's talk I headed in to listen to The Hardball Times Steve Treder talk about the interesting and lengthy career of Paul Richards. Treder was very entertaining and the talk was well received.
Chris Jaffe was up next discussing his two part study on managers, about which I'll write more in the future and then listened to an interesting talk on baseball's leaders by Don Frank in which he gave a nice overview of each of baseball's commissioners and assessed their strengths and weaknesses. I found interesting the discussion of William Eckert who was commissioner from 1965 to 1968 but was forced to resign when the owners thought the players were going to strike. Frank's conclusion was that Judge Landis and Peter Uberroth exhibited the best leadership skills (which include long range thinking, influence, vision, political skills, big picture view etc.), although of course both have major strikes against them with Landis and his non-handling of racial integration and Uberroth and collusion, which by the way, was written about very nicely by Maury Brown in Rob Neyer's book on baseball blunders. Frank rated Eckert the worst.
Now it's time to go up to and peruse the books and posters a little more…
Payroll Hogs
Today my column on Baseball Prospectus centers around salary variation within teams. As a part of that analysis I took a look at the 100 players who consumed the greatest portion of their team's payroll since 1990 (using the Lahman database which includes start of the season salaries and does not include the entire 40 man roster). In short, my conclusion is that salary variation is correlated with winning games in the regular season and less so in the post season.
While I reference the list in the article I didn't have space to share the entire list so here it is....
                 Pct                Div
Year Team Name                 Sal  Pyroll Pyroll   W   L    Pct Rnk WC Div Lg WS
1996 DET  Cecil Fielder        $9.2  $23.4  39.4%  53 109  0.327  5   N  N  N  N
2004 TOR  Carlos Delgado      $19.7  $50.0  39.4%  67  94  0.416  5   N  N  N  N
1997 DET  Travis Fryman        $6.4  $17.3  37.1%  79  83  0.488  3   N  N  N  N
2003 TOR  Carlos Delgado      $18.7  $51.3  36.5%  86  76  0.531  3   N  N  N  N
1998 FLO  Gary Sheffield      $14.9  $41.3  36.1%  54 108  0.333  5   N  N  N  N
2000 FLO  Alex Fernandez       $7.0  $19.9  35.2%  79  82  0.491  3   N  N  N  N
1999 FLO  Alex Fernandez       $7.0  $21.1  33.2%  64  98  0.395  5   N  N  N  N
1996 OAK  Mark McGwire         $7.0  $21.2  33.2%  78  84  0.481  3   N  N  N  N
2003 TBA  Rey Ordonez          $6.5  $19.6  33.1%  63  99  0.389  5   N  N  N  N
2001 MIN  Brad Radke           $7.8  $24.1  32.1%  85  77  0.525  2   N  N  N  N
2004 MIL  Geoff Jenkins        $8.7  $27.5  31.7%  67  94  0.416  6   N  N  N  N
1991 MON  Dennis Martinez      $3.3  $10.7  31.1%  71  90  0.441  6  N/A N  N  N
2005 KCA  Mike Sweeney        $11.0  $36.9  29.8%  56 106  0.346  5   N  N  N  N
1997 OAK  Mark McGwire         $7.2  $24.0  29.8%  65  97  0.401  4   N  N  N  N
2003 TBA  Ben Grieve           $5.5  $19.6  28.0%  63  99  0.389  5   N  N  N  N
2001 ANA  Mo Vaughn           $13.2  $47.5  27.7%  75  87  0.463  3   N  N  N  N
1995 ML4  Greg Vaughn          $4.9  $17.8  27.4%  65  79  0.451  4   N  N  N  N
1999 CHA  Frank Thomas         $7.0  $25.6  27.3%  75  86  0.466  2   N  N  N  N
2003 KCA  Mike Sweeney        $11.0  $40.5  27.1%  83  79  0.512  3   N  N  N  N
1996 ML4  Greg Vaughn          $5.9  $21.7  27.0%  80  82  0.494  3   N  N  N  N
2005 TEX  Chan Ho Park        $15.0  $55.8  26.9%  79  83  0.488  3   N  N  N  N
1996 MIN  Kirby Puckett        $6.2  $23.1  26.8%  78  84  0.481  4   N  N  N  N
2004 CIN  Ken Griffey         $12.5  $46.6  26.8%  76  86  0.469  4   N  N  N  N
2004 PIT  Jason Kendall        $8.6  $32.2  26.6%  72  89  0.447  5   N  N  N  N
2005 COL  Todd Helton         $12.6  $47.8  26.3%  67  95  0.414  5   N  N  N  N
2005 COL  Preston Wilson      $12.5  $47.8  26.1%  67  95  0.414  5   N  N  N  N
1998 CHA  Albert Belle        $10.0  $38.3  26.1%  80  82  0.494  2   N  N  N  N
2001 CIN  Ken Griffey         $12.5  $49.0  25.5%  66  96  0.407  5   N  N  N  N
2002 TBA  Greg Vaughn          $8.8  $34.4  25.5%  55 106  0.342  5   N  N  N  N
2004 TEX  Chan Ho Park        $14.0  $55.1  25.4%  89  73  0.549  3   N  N  N  N
2004 TBA  Tino Martinez        $7.5  $29.6  25.4%  70  91  0.435  4   N  N  N  N
2002 TOR  Carlos Delgado      $19.4  $76.9  25.2%  78  84  0.481  3   N  N  N  N
1995 DET  Cecil Fielder        $9.2  $37.0  24.9%  60  84  0.417  4   N  N  N  N
1996 KCA  Kevin Appier         $5.1  $20.3  24.9%  75  86  0.466  5   N  N  N  N
2001 TEX  Alex Rodriguez      $22.0  $88.6  24.8%  73  89  0.451  4   N  N  N  N
1995 MIN  Kirby Puckett        $6.3  $25.4  24.8%  56  88  0.389  5   N  N  N  N
2005 SFN  Barry Bonds         $22.0  $90.2  24.4%  75  87  0.463  3   N  N  N  N
1994 SDN  Tony Gwynn           $3.6  $14.9  24.4%  47  70  0.402  4  N/AN/AN/AN/A
1997 SFN  Barry Bonds          $8.7  $35.6  24.3%  90  72  0.556  1   N  Y  N  N
1995 MON  Moises Alou          $3.0  $12.4  24.3%  66  78  0.458  5   N  N  N  N
2003 DET  Bobby Higginson     $11.9  $49.2  24.1%  43 119  0.265  5   N  N  N  N
1995 PIT  Jay Bell             $4.4  $18.4  24.0%  58  86  0.403  5   N  N  N  N
1998 OAK  Kenny Rogers         $5.0  $21.3  23.5%  74  88  0.457  4   N  N  N  N
2005 HOU  Jeff Bagwell        $18.0  $76.8  23.4%  89  73  0.549  2   Y  N  Y  N
2005 HOU  Roger Clemens       $18.0  $76.8  23.4%  89  73  0.549  2   Y  N  Y  N
2002 TBA  Wilson Alvarez       $8.0  $34.4  23.3%  55 106  0.342  5   N  N  N  N
2003 OAK  Jermaine Dye        $11.7  $50.3  23.2%  96  66  0.593  1   N  Y  N  N
1997 HOU  Jeff Bagwell         $8.0  $34.8  23.1%  84  78  0.519  1   N  Y  N  N
2004 KCA  Mike Sweeney        $11.0  $47.6  23.1%  58 104  0.358  5   N  N  N  N
1998 CIN  Barry Larkin         $5.3  $23.0  23.0%  77  85  0.475  4   N  N  N  N
2005 BAL  Sammy Sosa          $17.0  $73.9  23.0%  74  88  0.457  4   N  N  N  N
2005 TOR  Roy Halladay        $10.5  $45.7  23.0%  80  82  0.494  3   N  N  N  N
1995 FLO  Gary Sheffield       $5.6  $24.5  22.9%  67  76  0.469  4   N  N  N  N
2004 ARI  Randy Johnson       $16.0  $69.8  22.9%  51 111  0.315  5   N  N  N  N
2000 CHA  Frank Thomas         $7.1  $31.1  22.8%  95  67  0.586  1   N  Y  N  N
1996 SFN  Barry Bonds          $8.4  $37.1  22.7%  68  94  0.420  4   N  N  N  N
2000 FLO  Cliff Floyd          $4.5  $19.9  22.6%  79  82  0.491  3   N  N  N  N
1991 TOR  Joe Carter           $3.8  $16.9  22.4%  91  71  0.562  1  N/A Y  N  N
1995 SFN  Barry Bonds          $8.2  $36.5  22.4%  67  77  0.465  4   N  N  N  N
2000 TOR  Raul Mondesi        $10.0  $44.8  22.3%  83  79  0.512  3   N  N  N  N
2002 COL  Larry Walker        $12.7  $56.9  22.3%  73  89  0.451  4   N  N  N  N
2003 MON  Vladimir Guerrero   $11.5  $51.9  22.1%  83  79  0.512  4   N  N  N  N
1996 DET  Travis Fryman        $5.2  $23.4  22.1%  53 109  0.327  5   N  N  N  N
1996 TOR  Joe Carter           $6.5  $29.6  22.1%  74  88  0.457  4   N  N  N  N
1996 TOR  John Olerud          $6.5  $29.6  22.0%  74  88  0.457  4   N  N  N  N
2004 SFN  Barry Bonds         $18.0  $82.0  21.9%  91  71  0.562  2   N  N  N  N
1993 FLO  Bryan Harvey         $4.2  $19.3  21.9%  64  98  0.395  6  N/A N  N  N
2000 ANA  Mo Vaughn           $11.2  $51.5  21.7%  82  80  0.506  3   N  N  N  N
2002 MIN  Brad Radke           $8.8  $40.4  21.6%  94  67  0.584  1   N  Y  N  N
2004 CHA  Magglio Ordonez     $14.0  $65.2  21.5%  83  79  0.512  2   N  N  N  N
1994 FLO  Gary Sheffield       $4.6  $21.6  21.4%  51  64  0.443  5  N/AN/AN/AN/A
2003 TEX  Alex Rodriguez      $22.0 $103.5  21.3%  71  91  0.438  4   N  N  N  N
2003 SDN  Trevor Hoffman       $9.6  $45.2  21.2%  64  98  0.395  5   N  N  N  N
2004 HOU  Jeff Bagwell        $16.0  $75.4  21.2%  92  70  0.568  2   Y  N  N  N
2000 MIN  Brad Radke           $3.5  $16.5  21.2%  69  93  0.426  5   N  N  N  N
1992 MON  Dennis Martinez      $3.3  $15.8  21.2%  87  75  0.537  2  N/A N  N  N
1997 ML4  Ben McDonald         $5.0  $23.7  21.1%  78  83  0.484  3   N  N  N  N
1997 MIN  Kirby Puckett        $7.2  $34.1  21.1%  68  94  0.420  4   N  N  N  N
2004 CLE  Matt Lawton          $7.3  $34.3  21.1%  80  82  0.494  3   N  N  N  N
1994 MON  Larry Walker         $4.0  $19.1  21.1%  74  40  0.649  1  N/AN/AN/AN/A
2003 CIN  Ken Griffey         $12.5  $59.4  21.1%  69  93  0.426  5   N  N  N  N
1997 PIT  Al Martin            $2.3  $10.8  21.0%  79  83  0.488  2   N  N  N  N
2001 OAK  Johnny Damon         $7.1  $33.8  21.0% 102  60  0.630  2   Y  N  N  N
1998 SFN  Barry Bonds          $8.9  $42.6  20.9%  89  74  0.546  2   N  N  N  N
2002 TEX  Alex Rodriguez      $22.0 $105.5  20.8%  72  90  0.444  4   N  N  N  N
1995 SEA  Ken Griffey          $7.6  $36.5  20.8%  79  66  0.545  1   N  Y  N  N
2002 MON  Vladimir Guerrero    $8.0  $38.7  20.7%  83  79  0.512  2   N  N  N  N
1991 CHA  Tim Raines           $3.5  $16.9  20.7%  87  75  0.537  2  N/A N  N  N
1991 MON  Ivan Calderon        $2.2  $10.7  20.6%  71  90  0.441  6  N/A N  N  N
1999 OAK  Kenny Rogers         $5.0  $24.4  20.5%  87  75  0.537  2   N  N  N  N
2002 BAL  Albert Belle        $12.4  $60.5  20.4%  67  95  0.414  4   N  N  N  N
1996 PIT  Jay Bell             $4.7  $23.0  20.4%  73  89  0.451  5   N  N  N  N
1994 NYN  Bobby Bonilla        $6.3  $31.0  20.4%  55  58  0.487  3  N/AN/AN/AN/A
2005 PIT  Matt Lawton          $7.8  $38.1  20.3%  67  95  0.414  6   N  N  N  N
1995 PHI  Lenny Dykstra        $6.2  $30.6  20.3%  69  75  0.479  3   N  N  N  N
1999 MIN  Rick Aguilera        $4.3  $21.3  20.2%  63  97  0.394  5   N  N  N  N
2003 FLO  Ivan Rodriguez      $10.0  $49.5  20.2%  91  71  0.562  2   Y  N  Y  Y
1996 MIN  Chuck Knoblauch      $4.7  $23.1  20.2%  78  84  0.481  4   N  N  N  N
2005 CIN  Ken Griffey         $12.5  $61.9  20.2%  73  89  0.451  5   N  N  N  N
2003 MIL  Jeffrey Hammonds     $8.2  $40.6  20.2%  68  94  0.420  6   N  N  N  N
SABR36 Day 2: Morning
This morning I attended the SABR Records Committee meeting where the main topic of discussion was the upcoming "SABR Record Book" (title not finalized). There are hundreds of lists that are in development and the committee is currently vetting the lists and looking for members to help. The lists will be on the SABR members site so everyone can provide feedback. The book is using 1983 as the cut-off as the beginning of the modern game and the plan is to be current through the 2006 season with the book being released by springs of 2007.
After the opening ceremonies that were littered with whereases from the various statements read by the county, state legislature, and governor, I took in the Retrosheet "committee" meeting. Retrosheet is actually a separate organization with five members and so they're not really a SABR committee. The meeting was chaired by Dave Smith and included Clem Comly and David Vincent both of whom are well known in the sabermetric committee. As was mentioned in The Numbers Game the server actually uses a DSL connection and is located in Smith's basement and is therefore prone to situations like the one that happened last June. For a tool that is becoming indispensable to so many in the research and the media it would be nice to see the volume of contributions rise just as the number of hits has. The site currently averages over 2,000 hits per weekday and 1,500 or 1,600 per day on the weekend.
It's probably worth noting (since I wasn't aware of it until recently) that although the play by play data goes back to 1957 on Retrosheet, that doesn't mean that those seasons are 100% complete (for example 1973 is missing nine games). And as more seasons are released the likelihood that the season won't be complete grows. As a result they also have a boxscore format that they're collecting data for in order to have a complete record of the games. The results for the box (but not the lineup position and some other data) are taken from the daily logs also known as "official dailies" used by the league office. Smith showed one from 1927 to track Babe Ruth's statistics. Retrosheet has purchased microfilm from the Hall of Fame going back to around 1880 and needs volunteers to convert these dailies into spreadsheets. There was some discussion of using optical character recognition but that hasn't been attempted to date.
Interestingly, there was also an update on the data that was collected for umpires. It turns out that the only incomplete seasons going back to 1920 are 1979 (because of the subs used during that year), and 1989 where around 80 games are missing. Data is also now being collected and entered for 1882 AA, 1910, 1917, and 1920.
Wednesday, June 28, 2006
SABR36 Day 1
Well, day one at SABR36 is complete. After arriving at the hotel and meeting Maury and his buddy Tim Chamberlain (a die hard Red Sox fan with a tattoo on his arm reading 10-27-04 – the interpretation of which is left to the reader), Maury and I briefly worked on our presentation for tomorrow afternoon after which Tim and I took the less than a mile walk down to SafeCo Field and took the 2:30 tour. 
We had missed the SABR-only tour that left an hour earlier but it was still interesting and starting at the team store took us through the main concourse, the upper deck to get a good look at the retractable roof, the owners luxury suite, the media press box, the field and Mariners dugout, the really expensive seats and the restaurant under the stands, the media room, and finally the visitors clubhouse and batting cage. In all the tour lasted a good hour and a half and was well done by our guide despite a few factual errors (she retold the apocryphal story of Ruth being sold to the Yankees to finance "No No Nannette", kept calling the manager the "head coach", mixed in with a few other legends). 
After having now attended more than 30 games at Coors Field I was struck by the similarities of SafeCo and Coors – which of course makes sense since they were built by the same company. The views from the concourses and the upper deck looking down on the field are so similar that when cropped it's difficult to tell which field you're looking at. And like Coors, SafeCo has an underground system using heated water that allows them to keep the grass (a mixture of rye and bluegrass cut to one inch in length) growing year round. When asked how many times the roof is closed for a game our guide said 6 or 7 times last year, which seems like a lot of money ($65M for the roof out of the over $500M cost) for little benefit. 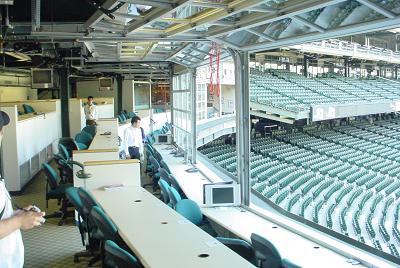
I also discovered that the press box was very large originally and because some of the space went unused a portion was converted into a luxury suite complete with all the food you can eat that seats 18 and goes for between $5,000 and $8,000 per game. The press box also contains high definition monitors within view of almost everyone, an amenity that speaking as an MLB.com stringer, would be very helpful to check pitch location. 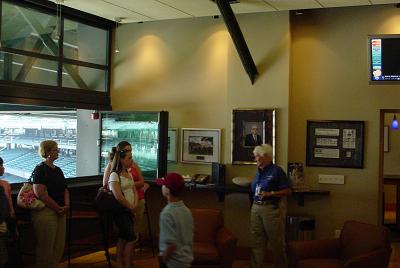
The owner's luxury suites, and in fact many of the suites and the exclusive restaurant are stocked with historical baseball photographs and displays purchased by one of the owners of the Mariners who is a Microsoft executive. Some of the images were quite interesting and included a huge photo of Babe Ruth and Lou Gehrig on the deck of a ship doing some deep sea fishing and a copy of Ruth's 1932 contract with the Yankees. 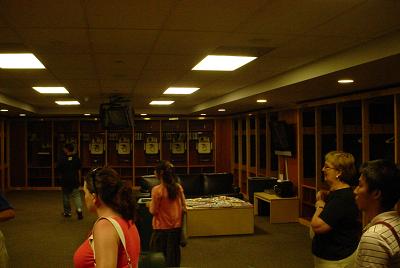
After the tour we hoofed it back to the hotel (uphill of course) and I hung out in the bar watching and talking baseball. This evening there was the SABR annual business meeting, which like most business meetings wasn't exactly riveting. I did learn that there are over 520 attendees here and over 7,100 SABR members with an average age of 54. Next year the convention will be in St. Louis and in 2008 in Cleveland. Long day but looking forward to committee meetings and research presentations tomorrow.
SABR 36
![]()
Just arrived in Seattle for the 36th Society for American Baseball Research convention. This is my first convention since re-upping with SABR in the spring of 2003 (I was briefly a member in 1983 at the age of 15) and am very much looking forward to meeting and talking baseball some of those I've corresponded with over the past three or four years.
The convention is being held downtown at the Renaissance Hotel on Madison street and as I am encamped here in the lobby enjoying the wireless access I've run across several folks attending the convention. Not the least among them was Maury Brown of the Business of Baseball committee and of course Baseball Prospectus with whom I'll be rooming.
The research presentations and most other activities actually begin tomorrow but I was forced to take an early flight this morning. I'll be posting updates here periodically with all the baseball-goodness that I'm sure will follow.
Tuesday, June 27, 2006
Mikulik Meltdown
If you haven't seen the meltdown yet take a look at it here.
There's certainly a precedent for each little behavior that Asheville Tourists Manager Joe Mikulik displayed but I've never seen a situation where a manager felt it necessary to do all of them at once. Of course the Tourists are a farm club of the Rockies but I haven't heard any reaction from the organization.
Luck in the Journal
There was a nice article on baseball and luck in the Wall Street Journal Weekend Edition on Saturday by Russell Adams that dovetails nicely with some of the things I've written before. One of the passages I found interesting was this about how teams are now factoring randomness into their evaluations:Most teams are tight-lipped about their use of luck-related statistics, but baseball executives acknowledge that it's becoming part of the decision-making process. Teams including the Red Sox, Indians and Oakland Athletics say they seek to weed out random factors in assessing players.
For the San Diego Padres, currently leading the National League West, measuring randomness will help guide critical decisions as baseball's July 31 trade deadline approaches. Among other things, the Padres use a method to calculate a statistic known as EOPS, which is a combination of a player's expected on-base percentage (the percentage of his at-bats he gets on base safely other than through errors or a fielder's choice) and his slugging percentage (a measure of batting average that gives more weight to extra base hits).
Before the Padres consider spending to beef up their lineup, they want to understand whether their division-leading season is more than just a fluke. "It's important to know: Are we for real or are we lucky?" says Kevin Towers, the team's general manager.
It would be interesting to know how they figure "Excpeted on base percentage" or whether this is simply a combination of OBP and SLUG as has been done before. Adams also talks a bit about the White Sox:As many fans intuitively know, skill can only take a team so far -- winning a championship requires a certain amount of luck. It's "pretty unusual" for the best team in the league to win the World Series, says Jim Albert, a professor at Bowling Green State University who uses baseball to teach statistics. By several measures, the 2005 Chicago White Sox were one of the luckiest World Series winners in modern baseball history, winning as many as nine extra games due to chance.
Although he has mentions the White Sox being lucky to the tune of nine games in 2005, the analysis I did had them at about 13 games or so but of course some of that is also due to good relief pitching and having a team that can consistently score between four and seven runs per game. Anyway, great stuff.
BTW, Joe Sheehan has a great article on BP where he discusses how the 2006 Sox, much like the 2005 version, are winning via the long ball and how reality and perception are in conflict.
Monday, June 26, 2006
Of Humidors and Humidity
Thanks everyone for providing feedback on my recent article discussing the humidor and the leveling of the playing field in Denver this season. There are a couple of points I'd like to clarify, however.
In the article I said the following:As mentioned in the previous column, it has been reported that the Rockies are now simply using balls that have been in the humidor longer. The effect of that practice is ostensibly to have the baseballs absorb more moisture, making them heavier with a lower coefficient of restitution (COR).
COR is a measure of the "bounciness" of the ball, or more precisely, it’s the ratio of the velocity of the ball when rebounding from a hard surface with its initial velocity. Major League Baseball specifies that the COR must be between .514 and .578, as measured by firing balls at 85 feet per second at a wall of ash.
As any kid can tell you after they leave their baseball in the yard all night in a rainstorm, combining these effects should serve to decrease the distance balls can be hit.
Several readers piggy-backed on this passage to ask whether a heavier ball would lead to arm injuries for Rockies pitchers or whether it would affect velocity or movement.
Well, as some of you know In the majors the ball has to weigh between 5.0 and 5.25 ounces and be between 9.0 and 9.25 inches in circumference. Without the humidor I would imagine that balls were weighing around 5 ounces with a circumference of 9 inches or even slightly less. With the humidor last year it was somewhere around 5.12 ounces and I don't know how many inches. One would assume with leaving the balls in there longer they are closer to 5.2 ounces and probably in the 9.15 inch range.
In retrospect the analogy I gave of leaving a ball out in a rainstorm wasn't great since it overstates the actual effect by a large amount. When you leave a ball out in the rain it probably increases the weight by 50% or more. A ball left in the humidor would feel and weigh very much like any baseball you might pick up so I couldn't conceive of it having any effect on injuries and I've never heard that mentioned in connection with the humidor before. After all, we're really talking about getting the ball to be more like those at other parks, not less.
One of the things pitchers have been saying in recent years with the humidor and more so this year is that the ball is easier to grip and the seams don't feel as tight which makes it easier to throw breaking balls. But of course the light air will always make it more difficult to get the same break at Coors than at sea level.
Other readers asked whether the Rockies could use the humidor to their advantage by, for example, soaking the ball a bit more with Brandon Webb in town or using a drier ball against a flyball pitcher when sinkerballer Jason Jennings is on the mound. That makes a certain amount of sense and I suppose we'll have to wait and see how opposing teams react.
Finally, I also mentioned in the article the following: The following table shows the number of non-bunt ground balls hit at Coors Field over the past few years and the number and percentage that went for hits.
        GB  GBH    PCT
2003  2100  474   22.6%
2004  2037  468   23.0%
2005  2108  497   23.6%
2006   828  158   19.1%
So again it would appear that ground balls are not making it through the infield quite as frequently and in fact the difference between 2006 and the previous three seasons is statistically significant at the 10% level (that is, there is a greater than 90% chance that the difference we're seeing reflects an underlying reality). One might then postulate that a key contributing factor is the length of the infield grass.
Of course my assumption here was that fewer groundball hits could be directly attributed to longer grass in the Coors field infield. That's not necessarily the case, however, and fewer groundballs going for hits could also be laid at the feet of heavier baseballs. Since both factors appear to be different this year, it's probably impossible to determine which has had the greater effect.
Wednesday, June 21, 2006
Smart Ball Architect
Great article today by John Walsh of The Hardball Times on measuring "smart" players. He used the same critiera that Bill James used in the New Historical Baseball Abstract but uses a more rigorous approach for both active and retired players since 1954. One could certainly argue that in addition to the four criteria used you could also include pick offs and weight them differently but the article is worth the read if simply for the closing paragraph.
I was very curious to see how Ozzie Guillen ranked based on the James method. It turns out he ranks 385 out of 555 players, in the bottom third. I actually expected him to rank lower, because on June 23, 1989, Ozzie fell for the ol' hidden-ball-trick, getting fooled by Brewers first baseman Greg Brock. It's hard to imagine a less heads-up play that you can make on a baseball diamond. That's alright, Oz, anybody can get surprised once. The amazing thing is, just a couple of months later, on August 5, Ozzie was caught napping on first base again (yep, hidden-ball-trick again), this time by the Tiger first-sacker Dave Bergman. Well, it appeared that Ozzie had finally learned the lesson, since he avoided being embarrassed for the next season and a half or so. But, no, in May 1991 he fell victim to the hidden ball trick a third time. So, yes, sometimes a player does contribute in a way that does not show up in the box score. Based on Ozzie's intangibles, I believe he deserves an honorary position alongside none other than Dr. Strangeglove as the worst percentage player of all time.
The data on hidden balls tricks is listed on Retrosheet.
Tuesday, June 20, 2006
Baseball on TV
Couldn't agree more. From my vantage point in the press box you get to see the breaks outfielders make on fly balls and my personal favorite, the positioning of the defense which you only get to see on television if the third baseman or first baseman is 10 feet from the plate.
I'd also love to see a third or first base camera angle for a few pitches each inning as well as views from the left and right field stands. Occasionally a producer will get caught with an angle other than the centerfield camera and then they usually needlessly switch back to the angle just in time to catch the end of the pitch making sure you missed it by the time your eyes adjust.
The two innovations I really do like however, are the K-Zone on ESPN and the mid-game interviews with managers and pitching coaches.
Shutouts at Coors
At Coors Field tonight for the second game of the Rockies/A's three game set. Last night the Rockies got a homerun and three RBIs from Matt Holliday en route to a 7-0 win. Tonight is going well too as it is now 6-0 in the top of 7th. A's starter Estaban Loaiza got hit pretty hard and Rockies starter Jason Jennings has somehow managed to avoid giving up hits and keep putting up zeroes despite struggling with his control. In the top of the 7th he's thrown 107 pitches, 47 of them balls. But some things never change and once again Clint Hurdle elected to bunt with a runner on first and nobody out in the bottom of the first in a scoreless game. He also bunted in the second with runners on first and second and one out with Jennings at the plate - who is a very good hitting pitcher.
As I wrote about in my column on BP two weeks ago, Coors Field has played as almost a neutral park this year and I'll have more to say in this week's installment including some interesting fly ball distance and weather data. But interestingly, last night's shutout was the 6th of the season at Coors which matches the previous record of 6 set in 1997. Thus far the Rox have recorded 3 and the visitors have recorded 3. 2003 was the only other year in which there were as many as four shutouts here. To give some perspective Comerica Park, Minute Maid Park, and Safeco Field have all seen 7 shutouts this season and Petco Park has seen 6.
Update: Tonight's game ended in a 6-0 victory for the Rockies with the A's tallying just one hit (Jason Kendall hit a single on a soft fly to right to leadoff the game). So that makes it 7 shutouts at Coors this season. It was also the first one-hitter in club history and the third time the Rockies have thrown back to back shutouts, the others being in of April 2001 at San Diego and in April/May of 2002 vs. Pittsburgh.
Big Time Bonus
Here's an interesting story detailing the large bonus that may be paid to Cubs fifth round pick Jeff Samardzija, a pitcher/wide receiver, from Notre Dame. What's interesting is how large the bonus potentially could be if Samardzija commits to baseball eventually. Bud Selig also became personally involved in the negotiations apparently and given that the Dodgers were fined last year for paying more than slot money I'm sure the Cubs will also be dinged accordingly. The difference here, however, is that Samardzija, being a two-sport star, has a potentially large payoff in the NFL draft and so the Cubs had to offset that enticement and so the situations are a bit different.
Also, here's a transcript of the BP chat from yesterday.
Sunday, June 18, 2006
DaVinci Code
I should preface this post by saying that I've neither read the book nor seen the movie "The DaVinci Code" but I have read a bit about the historical claims author Dan Brown makes in the preface of the book. He also has repeated many of these claims in TV interviews throughout the last year. In a nutshell what Brown reports as historical facts in the preface and through the characters in his novel are anything but. Normally I wouldn't any problem with that sort of thing in a novel but in this case Brown skirts the line and gives a false reading of history to many ho have not looked into the issues before. The result is that people end up with a warped view of history that everyone who is interested in truth should be concerned about.
This morning I heard a succint message that dealt with many of these claims in a very clear way. Whether you're a Christian or not I think the information content here is pretty high and would recommend it. You can download the mp3 here.
Fear and Loathing in Wrigleyville
I sat down to enjoy a lazy Father's Day and watch Mark Prior's first start of the season on WGN. My afternoon was all but ruined after a lengthy top of the first in which Prior gave up six runs, three homeruns, made an error, and threw 39 pitches (his limit for the day was said to be 90 pitches). What I found most disturbing was that Prior clearly had no conception of how his breaking ball was working and as a result had to throw a succession of very straight 92 mph fastballs that were hit all over the yard. The disappointment was compounded by the Cubs allowing Kenny Rogers to get out of the first on eight pitches. Well, with Juan Pierre and Tony Womack as the first two hitters it wasn't really that surprising.
Interestingly, Prior had never given up a run in his first starts after coming off the disabled list (and he's done that several times as we all painfully know). Broadcaster Bob Brenly also noted that Prior's pitch counts were up last season because of his tendency to nibble. In watching Prior today it's not hard to understand why he feels the need to do so. His fastball simply has very little movement and when he misses with his breaking ball, he misses badly making it obvious what he'll throw when behind in the count. In 2005 almost 15% of opposing hitter's plate appearances against Prior ended at a 3-2 count whereas for Greg Maddux it was 8%. The following table shows those pitchers in 2005 who ran 50 or more full counts and the percentage of plate appearances that represents. As you can see Prior is in the top 16% or so although Zambrano is even higher.
                    3-2Count TotalPA    Pct
Ugueth Urbina             69     343   20.1%
Chan Ho Park             142     725   19.6%
Scott Eyre                54     283   19.1%
Al Leiter                131     689   19.0%
Ron Villone               53     296   17.9%
Erik Bedard              108     622   17.4%
Wade Miller               74     429   17.2%
Gil Meche                112     662   16.9%
Francisco Cordero         53     314   16.9%
Darrell May               52     312   16.7%
Andrew Sisco              56     339   16.5%
Hector Carrasco           61     371   16.4%
Joaquin Benoit            61     377   16.2%
Mike Wood                 86     532   16.2%
Oliver Perez              78     483   16.1%
Kyle Davies               66     409   16.1%
JP Howell                 55     344   16.0%
Giovanni Carrara          53     336   15.8%
Scot Shields              62     394   15.7%
Livan Hernandez          172    1094   15.7%
Aaron Heilman             70     451   15.5%
Scott Kazmir             130     844   15.4%
Tony Armas                71     466   15.2%
Carlos Zambrano          284    1864   15.2%
Barry Zito               146     980   14.9%
Daniel Cabrera           108     742   14.6%
Doug Davis               140     965   14.5%
Orlando Hernandez         86     594   14.5%
Kazuhisa Ishii            60     415   14.5%
Jason Schmidt            114     792   14.4%
Mark Prior               102     713   14.3%
Chris Young              102     719   14.2%
John Lackey              131     931   14.1%
Seth McClung             146    1040   14.0%
Scott Downs               58     414   14.0%
Vicente Padilla           92     662   13.9%
Russ Ortiz                78     563   13.9%
Luke Hudson               55     398   13.8%
Woody Williams            98     710   13.8%
Noah Lowry               242    1780   13.6%
Adam Eaton                79     582   13.6%
Jeff Fassero              54     398   13.6%
Robinson Tejeda           51     379   13.5%
Josh Beckett             100     745   13.4%
Victor Santos             88     657   13.4%
Roger Clemens            114     852   13.4%
Jake Peavy               112     840   13.3%
C.C. Sabathia            111     843   13.2%
Brad Hennessey            70     536   13.1%
Ervin Santana             78     599   13.0%
Jason Marquis            116     892   13.0%
Kris Benson               98     757   12.9%
Aaron Sele                69     533   12.9%
Kirk Rueter               64     498   12.9%
Brett Myers              120     934   12.8%
Glendon Rusch             85     663   12.8%
Hideo Nomo                62     484   12.8%
Mike Mussina             303    2367   12.8%
Brandon Claussen         192    1500   12.8%
Jerome Williams           69     548   12.6%
Brad Penny                95     760   12.5%
Runelvys Hernandez        91     734   12.4%
Aaron Harang             112     907   12.3%
Shawn Chacon              83     673   12.3%
Jose Lima                 97     797   12.2%
Mike Maroth              111     914   12.1%
Kip Wells                104     857   12.1%
Matt Clement             103     852   12.1%
Chris Capuano            118     977   12.1%
Zack Greinke             102     848   12.0%
Shawn Estes              130    1084   12.0%
Mark Redman               91     766   11.9%
Bronson Arroyo           106     893   11.9%
Jamie Moyer              107     903   11.8%
A.J. Burnett             108     916   11.8%
Rich Harden               62     527   11.8%
Victor Zambrano          184    1572   11.7%
Dan Haren                108     924   11.7%
Dave Bush                 70     599   11.7%
Kenny Rogers              97     831   11.7%
Dave Williams             71     610   11.6%
Casey Fossum             172    1490   11.5%
Byung-Hyun Kim            81     702   11.5%
Kirk Saarloos             81     703   11.5%
Kyle Lohse                89     785   11.3%
Rodrigo Lopez            107     949   11.3%
Esteban Loaiza           104     923   11.3%
Wandy Rodriguez           65     579   11.2%
Claudio Vargas            67     598   11.2%
Bruce Chen               192    1716   11.2%
Jose Contreras           102     912   11.2%
John Patterson            95     859   11.1%
Julian Tavarez            62     566   11.0%
Jeff Francis              94     859   10.9%
Joe Blanton               93     850   10.9%
Tom Glavine               99     912   10.9%
Ted Lilly                 63     581   10.8%
Gustavo Chacin            97     895   10.8%
Jarrod Washburn           81     750   10.8%
Ryan Drese                65     602   10.8%
Derek Lowe               104     964   10.8%
Tomo Ohka                 85     794   10.7%
Tomokazu Ohka             85     794   10.7%
Kevin Millwood            89     836   10.6%
Jon Garland               97     912   10.6%
Bartolo Colon             97     914   10.6%
DJ Carrasco               56     529   10.6%
Ben Sheets                69     653   10.6%
Jorge Sosa                63     599   10.5%
Josh Fogg                 80     762   10.5%
Ricardo Rodriguez         54     516   10.5%
Horacio Ramirez           91     874   10.4%
Brett Tomko               87     837   10.4%
Mark Hendrickson          84     810   10.4%
Javier Vazquez            95     918   10.3%
Chris Carpenter           99     966   10.2%
Steve Kline               56     548   10.2%
Dontrelle Willis          99     969   10.2%
Brandon Backe             68     670   10.1%
Joel Pineiro              85     840   10.1%
Ryan Franklin             86     850   10.1%
Jeff Suppan               86     853   10.1%
Brian Moehler             72     715   10.1%
Sidney Ponson             62     617   10.0%
Mark Mulder               89     892   10.0%
Andy Pettitte             88     887    9.9%
Cliff Lee                 84     853    9.8%
Tim Hudson                82     838    9.8%
Jeremy Bonderman          80     820    9.8%
DJ Houlton                58     598    9.7%
Jason Jennings            54     566    9.5%
Pedro Astacio             53     557    9.5%
Jeff Weaver               91     959    9.5%
Freddy Garcia             93     986    9.4%
Scott Elarton             74     789    9.4%
Johan Santana             86     928    9.3%
Roy Halladay              53     572    9.3%
Jake Westbrook            85     918    9.3%
Jason Johnson             85     925    9.2%
Matt Morris               76     829    9.2%
Jamey Wright              75     822    9.1%
Eric Milton               80     877    9.1%
Cory Lidle                74     818    9.0%
Joe Kennedy               65     721    9.0%
Joe Mays                  63     700    9.0%
Ramon Ortiz               70     781    9.0%
Tim Wakefield             88     983    9.0%
John Smoltz               85     953    8.9%
Dave Wells                71     798    8.9%
Pedro Martinez            76     861    8.8%
Nate Robertson            76     864    8.8%
Jon Lieber                78     929    8.4%
Brandon Webb              82     988    8.3%
Roy Oswalt                84    1016    8.3%
Mark Buehrle              81     989    8.2%
Doug Waechter             55     707    7.8%
Greg Maddux               75     983    7.6%
Randy Johnson             72     957    7.5%
Brian Lawrence            65     870    7.5%
Paul Byrd                 63     865    7.3%
Brad Radke                56     847    6.6%
Josh Towers               58     900    6.4%
Todd Jones                54     882    6.1%
In the second inning Prior showed better command and despite hitting Vance Wilson with two outs, was able to get out of the inning unscored on. Same basic story in the third before giving up yet another homerun in the fourth to make it 8-1 before being removed from the game. On the day he threw 88 pitches. The Cubs of course gave up eight homeruns for the second time this season and lost 12-3 for their sixth consecutive loss and their first winless homestand since 1997.
Having lost six in a row and on the verge of replacing the Pirates in the NL Central cellar, it doesn't get much worse than this. I continue to be amazed that quotes from the team and from their broadcasters don't seem to focus on the obvious – there simply is very little offensive talent on this team. Today's lineup featured Pierre, Womack, Jacque Jones, Henry Blanco, Matt Murton, and Ronny Cedeno. The only threats to actually hit the ball hard are a struggling Aramis Ramirez and Phi Nevin who recently lost his job with the Rangers. In the sixth inning today Len Casper and Brenly discussed the situation and seemed to be under the impression that it's all a matter of timing – when the pitching is good the hitting stinks and when they score runs they get poor starting pitching. Although I'm not sure what he meant, Brenly at one point indicated that the problems run very deep and that I think is much closer to the truth. It's really the architecture of the team that is to blame which falls squarely at the feet of GM Jim Hendry and manager Dusty Baker.
Which brings us to these nuggets of wisdom Dusty shared with the press as quoted on The Cub Reporter:
"I put Tony at the top because Juan was having trouble getting on base. … Juan’s a leadoff man, but Tony’s a leadoff man, too. It’s kind of a double leadoff man.”
“Tony Womack’s done pretty (darn) good, too, since he’s been here. … Not everybody wants power. I thought we wanted small ball for a while.”
“I love power. I love power and small ball. I like the option. It is a valid argument, but at the same time, some of my better defenses were with Womack out there, too, and speed. I’ll try to use them all if I can.”
Here's another small note. On Thursday Michael Barrett tweaked something taking a swing and as a result did not play all weekend. At the same time he's appealing his suspension meaning that if the suspension is upheld he'll likely miss over two weeks instead of just the 10 games. So why didn't he accept the suspension on Thursday night and begin serving it? Seems like they could have used up half the suspension in games in which he wouldn't have played anyway. When a player is suspended the team can't replace him on the roster and so Phil Nevin is the backup catcher (who caught in today's debacle) unless they want to send someone else down.
Friday, June 16, 2006
Visiting Parks
With my recent column on Fenway Park several readers have sent me their memories of various parks and lists of parks they've been to. In thinking about that I offer the following as my list of first visits to major league parks:
Thursday, June 15, 2006
More Fenway and Managers
Still in Boston at TechEd but my column on Fenway Park has been posted on BP. Appreciate all the feedback from those of you who have shared your Fenway experiences.
If you haven't seen it, here's part 1 of an interesting study on managers done by Chris Jaffe. I'll have some comments on it in a later post.
Monday, June 12, 2006
Fenway!
Spent a very fun day yesterday at Fenway Park attending the day/night doubleheader split between the Red Sox and Rangers and spent 12 hours at the ballpark. I was able to go down on the field before the game and I'll write about the entire day in my column this week on BP. 
Sunday, June 11, 2006
Quick Takes from the Hub
In Boston this week for Microsoft TechEd (and to catch a couple Red Sox games of course which I'll be writing about in the coming week). A couple interesting things:
I did though think the answers the Glasses gave were within the realm of possibility as far as leaving Baird to twist in the wind. Mr. Glass said they spent the first couple weeks trying to figure out who they could trade, who they could acquire, and the state of the minor league system, etc. before deciding apparently that the problems ran so deep that the only alternative was to fire Baird. One would hope that finding they could do little to nothing in the short term they didn't make Baird the scape goat in the wake of their announcement that something has to be done. But then again you certainly can't argue that Baird has done a good job and so the end seems justified. And just to show that I don't think everything Jason Whitlock writes is bad, I enjoyed this column.
The larger question though is how teams and the media interact. Because teams control access they have the potential to effectively censor what is written and said through that mechanism. The danger is that you end up with are beat reporters that do nothing more than act as mouthpieces for the team. And while the game could certainly use all the positive publicity it can get, obtaining it in that heavy-handed manner is not the way to do it. It seems to me this is especially an issue in professional sports where communities often have an investment in team via their facilities and therefore full disclosure is necessary.
Friday, June 09, 2006
Paranoid Delusions
With the recent Jason Grimsley leaked affadavit that names names (some of which are speculated on here) all kinds of people will be saying ridiculous things. One of those is Jason Whitlock, who is a columnist for the KC Star and also writes for ESPN. When I lived in KC he was also on the radio occasionally. Terrible radio personality by I digress...
Anyway, Whitlock wrote a piece for ESPN the other day where he said this:
"Well, I'm not sure I'm ready to blast these guys now for using their wealth to try to ease the pain and maximize their earning power. If a doctor or trainer told you he had a 'steroid' that could help you now and maybe prevent some additional pain later in life, would you take the drug? Would you worry about being vilified by the American media? Or worry about playing with your child in your 40s and 50s?"
Unfortunately Whitlock misses (or actually dismisses) the point that steroid use in sports is banned because it is both dangerous (anabolic steroids are a controlled substance and are illegal without a prescription) and creates an uneven playing field which damages the credibility of the entire enterprise. Now, if we want to have a debate in this country about what substances should and shouldn't be banned and how those substances can be prescribed when dealing with injuries, then I'm all for it. But this idea that professional athletes can somehow be excused when the rules were clear is absurd. And don't think that the MLB's lack of a policy or testing (for example regarding human growth hormone) provides justification either. MLB has no policy against most illegal activity but that doesn't mean it's ok.
And don't get me started on Whitlock's race related paranoia. Apparently, the feds asking Grimsley to wear a wire is proof that much of this is yet another racist ploy:
"Come on, even Bonds' critics must admit this witch hunt has nothing to do with cleaning up baseball. It's about creating headlines, securing promotions and advancing political careers one Willie Horton at a time."Truly mind boggling.
About the only relevant point Whitlock makes is that the Grimsley affadavit helps bring to the forefront the reality that pitchers were/are using illegal substances probably as much as hitters. But that point is not nearly enough to salvage this piece.
Tuesday, June 06, 2006
A 19 Inning Affair
For those who have been following my column on BP you might know that I've been writing the past couples weeks about the Win Expectancy (WX) framework developed by Keith Woolner and applying it to big plays and big comebacks. Well, this week I'll make some additions to those columns by including a few games that were left out of the analysis.
But in discussing some of those reader Jeff Bullington brought up the Mets/Braves game played on July 4, 1985 that went 19 innings and ended in a 16-13 Mets victory in the wee hours of the morning after 6 hours and 10 minutes. Jeff thought it would be interesting to look at the WX graph for that game and so here goes (click on the link to make it larger).
Saturday, June 03, 2006
Baseball on the Front Range
This weekend is loaded with baseball...could it get any better?
I drew all three games of the Rockies/Marlins series for MLB.com and am now sitting here in the press box getting ready for game 2. Last night the Marlins came away with a 4-2 victory behind a nice performance by Dontrelle Willis in 7 pretty strong innings (and 120 pitches I might add) to notch only his second win of the year. BTW, as I drove in to the park today I listened to the podcast of BP Radio with Will Carroll. Guests Jonathan Mayo, Kevin Goldstein, and Cleveland AGM/Dir, Scouting John Mirabelli were all very insightful. Interesting stuff for Royals, Indians, and Rockies fans for sure. Be sure also to check out Kevin's draft previews of both the AL and NL along with Rany Jazayerli's final installment of his draft study. Excellent stuff.
As has been the trend the Rox continued to struggle to score runs and now sit second to last in the NL in runs scored at 224 ahead only of the hapless Cubs at 207. They scored 2 or fewer runs for the eighth time in the last ten games - all of them losses. One of their problems is that they are third from the bottom in walks with the main culprits being Matt Holliday with 6 walks in 202 at bats and Clint Barmes with 3 walks in 192 AB (hate to say I told you so about Barmes but...). In April the Rox scored 2 runs or less in just 3 of 25 games. Back then they were scoring runs in bunches which I noted at the time was probably more indicative of good fortune than exceptional skill. That said, Todd Helton continues to struggle and so when he comes around the run scoring will increase as well. I continue to be impressed with rookie Ryan Spilborghs however. He is patient at the plate and can hit the ball with a little authority homering off of Willis last night. I'd like to see him log more time in centerfield and at least be the fourth outfielder.
One of the most impressive things I saw last night (and again the first inning tonight) is the hustle of Marlins rookie shortstop Hanley Ramirez. In both instances he hit line drives to left center that would normally be singles but instead of slowing up he never broke stride and beat the throws to second for doubles. The larger outfield at Coors makes this more possible than in other parks and I wonder if Ramirez has been doing this all season or if his visit to Coors inspired him.
The Rox lack of run scoring despite playing in Coors Field brings to mind the topic of the humidor and how Coors is playing this season. Many folks around the league think that Coors now plays neutral or even as more of a pitcher's park. I'll investigate that notion and how the sample size through 24 home games this season factors in next week in my Schrodinger's Bat column on Baseball prospectus.
Tonight I'll get to take a look at Rickey Nolasco who was perhaps the biggest component of the trade that sent Juan Pierre to the Cubs - a trade that may, when all is said and done, be counted as the worst trade of the Jim Hendry era as Cubs GM. It's rumored that the Cubs are already looking to shop Pierre but I imagine his .270 OBP makes that a difficult proposition. Nolasco's only been in the rotation a short time with one good outing against the Cubs and one bad against the Mets.
Tomorrow Jason Jennings, coming off of his 2-hit shutout will take the mound against Jeff Olsen and afterwards there will be a high school all-star game played at Coors Field which I hope to catch a few innings of.
But earlier today I had the opportunity to take my 10-year old daughter to a youth baseball clinic put on by the Major League Baseball Players Alumni Association. There was no fee thanks to sponsors such as Louisville Slugger and was hosted by the Air Force Academy and Falcons Field. It was a great event and featured several former big leaguers including:
There were about 180 kids there from ages 6 to 16. They were split by age group and rotated through a half dozen or so stations over about two and half hours. I was especially impressed with Neibauer, also a Yankees scout, who made all the kids laugh while teaching some basic throwing mechanics.
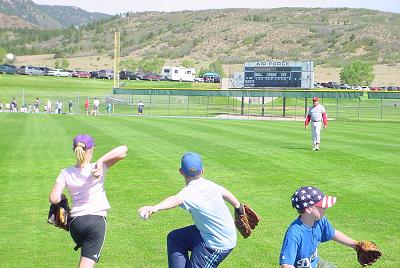
The hitting instruction was also done very nicely (I don't recall who was coaching however) and explained in a way that the kids could really understand the importance of "loading up" and shifting their weight, elbow position, and where their power comes from.
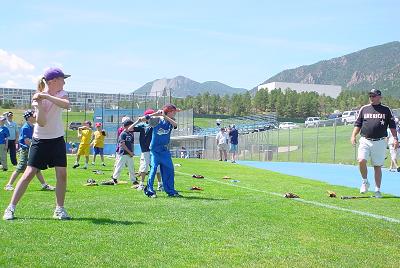
After the stations were complete Doug Loman took a few minutes to talk to all the players and parents about non-baseball issues, which was well-received. It was a great morning and both my daughter and I had a blast. This was the 9th year for the clinic here in Colorado Springs and we'll certainly be back next year (hopefully with my younger daughter as well).
Thursday, June 01, 2006
SABR36
We're in the month of June and so I'm getting excited about attending my first SABR convention in Seattle at the end of the month. Looking forward to meeting many of the folks I've corresponded with on email over the last couple of years and generally hanging out with people who enjoy baseball as much as I do.
One of those I'm looking forward to seeing is Maury Brown, who wrote for The Hardball Times and now writes for BP as well. He and I (ok, mostly he) will be presenting on the "2006 CBA and the Battles Within It" on Thursday June 29th. That talk will summarize some of the things that Maury and I have written about on the topic over the past few months.
Big Plays and Big Comebacks
Just a heads up that I have two new articles on BP this week. The first, Quantifying High Impact Performances takes a look at the biggest impact plays of 2005 using the Win Expectancy (WX) Framework. It turns out that the biggest plays typically result in a turnaround of about 70% and that the vast majority of such plays are walk-off homeruns.
The second article, Quantifying the Comeback, looks at the biggest comebacks from the WX perspective since 1970 (excluding 1999). Not surpisingly, the Indians Auguest 5, 2001 comeback from 12-0 was the winner as their low point was .0256% with two outs in the bottom of the 7th and trailing 14-3.
125x125_10off+copy.jpg)


