
More discussion surrounding the Gyroball in the last few days in the wake of the mention in October's Esquire magazine. More information including a video of a high school pitcher supposedly throwing the pitch can be found on Wikipedia.
Dave Baldwin, former pitcher and PhD noted on SABR-L that the pitch sounds like the kind of arm motion that Mike Marshall has been touting for years and that he demonstrated at this year's SABR convention. However, Marshall advocates the pronation motion on the release in order to alleviate injuries and doesn't claim you can get a "three foot" break on the ball as is claimed in the Esquire piece and noted by Jeff Passan in an article written during spring training.
Speaking of pitching, I found this note on ChicagoSports.com to epitomize much of the Cubs season.
"The Cubs on Tuesday set a major-league record with their 522nd pitching change, surpassing the Giants' mark set in 2004."
Friday, September 29, 2006
More Gyroball
Thursday, September 28, 2006
Trifecta
You gotta love baseball in September and the very long Phillies/Nats and Astros/Pirates games last night along with the dramatics by Albert Pujols against the Padres were about as good as it gets.
My column this week on Baseball Prospectus deals with triples in the wake of Carl Crawford's 15th triple hit last Sunday making him the first player to hit that many in three consecutive seasons since the banner offensive season of 1930. You'll also want to check out this fine article by John Walsh on triples published earlier this season.
Wednesday, September 27, 2006
Clogging
I missed this post on clogging the bases and the follow-on discussion on The Book blog which is very interesting. For what it's worth here are the advancement totals for balls hit into the outfield for the year 2000 (yes I have more recent data but was too lazy to dig it out).
Total      To2nd         To3rd        Scores   Thrown Out
Runner on First, Batter Singles, No Runner on Second
 5896    4012 (68%)    1759 (30%)     52 (1%)    45 (1%)

Runner on Second, Batter Singles, No Runner on Third
 3585                   927 (26%)   2523 (70%)  128 (4%)

Runner on First, Batter Doubles, No Runner on Second
 1537                   902 (59%)    574 (37%)   61 (4%)
Now these numbers don't necessarily bare directly on the topic of the post since it was about clogging the bases and in these cases we're looking only at opportunities where there was not a lead runner in play. When I get a chance I'll take a look at the difference between when a runner is on in front in these situations.
Thin Air
Here's a nice article on Coors Field by John Walsh over at The Hardball Times. Essentially the diminished offensive output at Coors that I wrote about in June has persisted although interestingly the Rockies fortunes at home and on the road have reverted to their historical trend.
On June 22nd the Rox stood at 16-16 at home and 18-18 on the road. Since then they've played 28-19 (.596) at home and 12-30 on the road (.286). I wrote in June that perhaps the decreased park factor would have the effect of leveling the playing field a bit as it seems the Rockies hitters suffer more on the road than their pitchers do. Unfortunately for the fans in Denver that doesn't appear to have been the case since Walsh also shows that the offense has averaged 5.53 runs per game at home and just 4.31 on the road while the defense has allowed 4.74 at home and 4.87 on the road. Clearly its the offense away from the thin air is to blame for their dismal second half. Outside of Brad Hawpe with his 929 OPS there has been little in the way of production in road games.
And speaking of Coors Field, I'm scoring my last game of the season for MLB.com tonight as the Dodgers hope to hold on to their wild card lead.
Update: Dave Metz at BP informs me that since August 3rd run scoring at Coors Field has been around 14.3 runs per game while on the road its at 9.79.
Saturday, September 23, 2006
More Quick Takes
Forgot to mention in my quick takes yesterday two items:
Friday, September 22, 2006
Quick Takes From Coors Field
Been a very busy week working three games for MLB.com at Coors Field, trying to get some writing done and then there's my day job. Like you care but in the absence of anything too substantial here are some quick takes on happenings around the game the last few weeks written during tonight's game (which the Rox won 6-4 on the strength of three hits from Todd Helton).
For what it's worth I also don't buy the argument that "the government" shouldn't be able to compel the release of the source(s) on the grounds that it was "the government" that may have leaked the testimony in the first place. Obviously that argument taken to its logical end would mean that no one in government could be held accountable for anything.
"Our system is in pretty good shape. I've got to compliment (farm director) Johnny Almaraz and his people. We had a winning record in the minors. We had two teams qualify for the postseason. We had three batting champions. ... You never have enough good players. The one thing I'm most proud of is we got through the year very healthy. In 2005, we had 44 arm surgeries, a lot of them major. This year, we had 14, without one being major. We're doing a lot of things right."
I cite this since some readers may have missed it and because it contains the kind of information you don't often hear when a GM is interviewed. Not that they don't have this information readily available or for all I know, keep it in the forefront of their thinking, but it does give a sense that Krivsky keeps a sharp eye on the source of his future major leaguers.
Thursday, September 21, 2006
Legos and Scorers
My column published today discussed official scoring decisions and presented some data related to errors scored for teams at home and on the road as well as data for individual scorers. In the intro to the piece I recounted a play I had witnessed in May of 2004 at Kauffman stadium. I've been alerted by several readers that the play was "recorded" in Lego-vision here. Very cool.
Monday, September 18, 2006
Contributions on the Bases
Last week my column took a look at some of the larger issues with regards to the baserunning metrics I've been developing this summer. The first part of the column examined how teams stacked up and because space didn't permit the entire list, here are all 180 teams from 2000 through 2005 ranked by year and the net theoretical contribution in terms of runs.
Year Team Opps EqGAR Opps EqAAR Opps PO CS EqSBR Opps OA EqHAR Total
2000 KCA 326 2.68 307 4.33 156 4 39 -0.68 461 8 3.48 9.81
2000 CHA 330 0.10 286 2.23 163 7 49 -3.35 390 6 7.70 6.67
2000 COL 315 5.35 299 1.93 191 7 68 -12.45 445 7 11.28 6.12
2000 CIN 304 2.43 295 4.49 139 7 45 -5.91 382 7 -0.45 0.56
2000 SDN 314 0.28 253 3.87 183 5 58 -9.53 306 6 4.45 -0.93
2000 SFN 279 2.57 291 3.96 120 4 43 -9.50 382 7 -0.24 -3.21
2000 TEX 318 -3.59 291 -0.32 119 4 51 -10.09 425 2 9.95 -4.06
2000 MIL 290 1.82 237 4.39 117 3 47 -13.47 329 7 3.15 -4.11
2000 FLO 282 -1.39 274 -3.17 230 12 67 -5.92 324 5 4.91 -5.58
2000 PHI 293 1.59 262 -4.24 135 6 36 -0.33 339 10 -3.66 -6.65
2000 PIT 319 1.88 286 -1.60 132 9 49 -9.39 346 7 2.43 -6.68
2000 DET 292 1.45 307 -5.32 123 6 44 -10.52 426 3 6.15 -8.23
2000 ATL 332 1.80 258 0.69 200 6 62 -7.45 357 11 -4.05 -9.01
2000 OAK 282 -1.27 287 -0.37 55 4 19 -3.08 378 12 -5.03 -9.74
2000 NYN 279 0.43 275 3.71 112 3 49 -12.79 349 6 -1.26 -9.91
2000 CLE 280 -1.67 290 -6.41 143 2 36 0.44 395 11 -2.43 -10.07
2000 ARI 275 -0.57 318 2.17 140 4 48 -10.74 365 12 -1.26 -10.40
2000 LAN 287 -2.94 276 1.62 140 5 47 -8.42 334 8 -1.03 -10.76
2000 SEA 313 -0.60 305 4.35 178 7 63 -14.84 352 8 0.03 -11.06
2000 MIN 325 -0.25 276 4.62 138 5 50 -11.70 398 10 -4.73 -12.06
2000 NYA 269 -4.12 298 1.82 150 6 54 -12.21 393 5 2.20 -12.31
2000 SLN 302 0.56 274 1.00 143 7 58 -14.76 383 7 0.32 -12.88
2000 CHN 317 1.64 244 0.18 130 5 42 -5.25 346 12 -9.83 -13.26
2000 ANA 290 3.59 299 -6.10 150 7 59 -11.82 395 9 0.48 -13.86
2000 TOR 274 -1.44 267 -0.56 128 6 40 -4.01 385 10 -9.02 -15.02
2000 TBA 292 0.90 282 -1.21 135 2 48 -7.65 352 11 -7.21 -15.18
2000 BAL 293 -3.54 337 -2.28 190 5 70 -12.93 391 6 3.01 -15.74
2000 MON 361 5.03 254 -2.59 114 9 57 -18.25 327 8 0.00 -15.82
2000 HOU 291 0.05 285 -0.84 170 9 61 -13.31 400 9 -2.70 -16.80
2000 BOS 282 -0.96 324 -3.86 78 5 35 -9.97 381 10 -6.73 -21.52
--------------------------------------------------------------------------------------------
2001 SEA 297 -1.06 320 2.80 212 7 49 -0.83 421 6 8.67 9.57
2001 COL 354 3.13 251 0.74 188 10 64 -9.03 379 8 11.47 6.31
2001 TEX 252 -1.33 305 4.24 130 8 40 -1.20 372 9 4.34 6.05
2001 OAK 238 -0.95 275 2.58 98 4 33 -5.41 341 4 4.93 1.15
2001 ANA 268 3.81 316 -0.08 169 5 57 -10.19 381 7 5.90 -0.56
2001 SLN 332 1.18 269 -1.31 129 8 43 -8.47 329 9 7.47 -1.12
2001 PHI 268 0.37 294 3.97 195 6 53 -3.93 346 9 -1.62 -1.21
2001 KCA 328 0.20 289 0.21 147 8 50 -6.78 360 6 3.64 -2.75
2001 FLO 311 2.40 269 -2.36 133 5 45 -3.91 316 4 0.30 -3.57
2001 NYA 282 -3.82 287 1.76 218 9 62 -5.04 327 4 3.42 -3.69
2001 ARI 301 1.66 285 -1.77 111 4 42 -9.27 316 6 3.61 -5.78
2001 CHA 283 2.70 260 3.08 187 13 72 -14.05 314 6 1.88 -6.40
2001 BAL 267 -0.49 275 1.49 189 9 62 -9.31 317 7 0.99 -7.32
2001 MIN 302 -0.69 240 0.72 213 8 75 -12.22 344 11 4.11 -8.08
2001 CHN 323 1.87 242 0.08 104 3 39 -10.66 347 6 -1.03 -9.74
2001 TOR 295 -0.79 260 -0.38 218 10 65 -5.90 328 8 -3.55 -10.62
2001 SDN 255 -3.07 284 1.48 173 10 54 -8.53 325 7 -1.63 -11.75
2001 HOU 308 1.28 277 0.66 116 3 52 -13.82 354 10 -0.81 -12.69
2001 TBA 309 -0.55 211 -1.29 166 3 55 -8.48 351 10 -2.54 -12.86
2001 DET 282 0.64 274 -0.93 198 8 69 -11.14 318 11 -1.63 -13.07
2001 ATL 324 1.33 262 -0.17 132 5 51 -13.52 331 15 -2.09 -14.45
2001 CLE 306 0.69 287 -5.20 123 5 46 -9.90 357 8 -1.06 -15.48
2001 LAN 274 -0.99 257 1.53 134 6 48 -8.60 292 13 -7.44 -15.50
2001 CIN 302 -1.09 231 1.04 161 8 62 -16.18 331 12 -2.22 -18.45
2001 MIL 269 2.41 222 0.97 108 8 44 -12.72 311 13 -12.07 -21.41
2001 PIT 299 3.61 255 -4.43 170 9 82 -26.71 285 8 5.72 -21.81
2001 MON 325 0.08 252 -2.74 154 8 59 -16.85 310 6 -3.74 -23.24
2001 BOS 266 -1.07 249 -3.03 83 4 39 -12.77 356 13 -10.39 -27.27
2001 SFN 267 0.57 281 -4.68 103 5 47 -13.65 332 11 -12.23 -29.99
2001 NYN 259 -1.16 297 -8.34 120 7 55 -20.72 328 12 -2.42 -32.64
--------------------------------------------------------------------------------------------
2002 NYA 270 -2.79 286 -0.05 141 5 43 -2.17 376 7 5.19 0.18
2002 TOR 245 -1.99 283 2.19 91 4 22 -1.60 350 6 0.58 -0.82
2002 TEX 271 2.61 305 -0.32 97 1 35 -7.76 348 5 3.87 -1.60
2002 SLN 296 2.45 302 -3.13 129 4 46 -9.52 363 8 6.43 -3.76
2002 LAN 349 -2.11 252 0.69 137 8 45 -6.29 323 6 2.52 -5.19
2002 SFN 295 2.77 275 1.79 102 8 29 -3.61 340 11 -6.69 -5.75
2002 OAK 247 -3.38 273 2.36 67 4 24 -5.24 351 7 -0.77 -7.03
2002 TBA 270 -2.52 241 0.78 151 6 51 -6.79 328 7 1.36 -7.17
2002 COL 287 2.38 240 -0.31 164 11 64 -15.29 350 10 5.99 -7.22
2002 MON 348 2.60 246 2.47 182 2 66 -15.06 328 13 2.09 -7.91
2002 CIN 317 0.09 213 -0.23 167 3 55 -9.38 279 8 1.39 -8.14
2002 BAL 285 0.05 266 -1.69 161 5 53 -7.11 297 11 0.50 -8.24
2002 CHN 294 1.21 231 -0.14 90 7 28 -4.49 305 7 -5.07 -8.50
2002 DET 251 -1.45 251 3.27 110 2 46 -13.40 338 12 2.33 -9.26
2002 FLO 337 1.37 260 -0.34 247 5 78 -10.21 323 10 -0.35 -9.53
2002 PIT 272 0.35 267 0.16 132 5 54 -12.50 294 5 1.81 -10.18
2002 ANA 306 2.25 357 -3.87 169 5 56 -8.71 437 8 -0.23 -10.56
2002 NYN 324 2.60 233 -3.02 136 8 50 -13.00 328 10 2.59 -10.83
2002 SEA 287 -0.74 324 1.03 194 9 67 -13.16 363 8 1.24 -11.63
2002 BOS 280 -2.32 297 -2.50 114 7 35 -3.96 371 13 -5.65 -14.44
2002 PHI 323 -4.40 274 -2.05 150 7 50 -7.96 343 9 -0.23 -14.64
2002 HOU 268 -2.49 235 -0.54 102 6 33 -7.63 365 13 -4.47 -15.13
2002 MIN 323 -0.99 271 2.79 138 2 64 -18.60 366 8 1.22 -15.58
2002 KCA 265 -0.23 291 -2.93 208 7 72 -15.53 343 12 3.07 -15.63
2002 CLE 292 -2.45 228 1.75 91 2 39 -11.20 319 8 -4.61 -16.51
2002 ATL 320 -2.81 272 -1.57 118 4 43 -11.67 337 8 -1.41 -17.45
2002 ARI 304 -1.13 281 1.25 142 6 52 -12.35 340 11 -5.57 -17.79
2002 SDN 312 -0.96 254 -3.91 114 5 49 -15.11 337 10 0.00 -19.96
2002 CHA 254 -1.48 307 -3.35 116 13 44 -12.54 329 12 -2.60 -19.98
2002 MIL 339 -1.21 241 -4.92 155 13 63 -17.51 317 12 -4.51 -28.15
--------------------------------------------------------------------------------------------
2003 OAK 289 -2.49 299 2.26 61 2 16 -0.25 401 11 5.23 4.75
2003 SLN 325 2.96 301 2.39 107 3 35 -6.60 478 11 2.74 1.50
2003 NYN 322 2.14 240 3.29 105 6 37 -7.22 379 7 2.68 0.89
2003 MIN 338 0.80 280 2.88 145 10 54 -8.88 461 8 4.92 -0.28
2003 CHA 281 0.38 264 -2.68 111 7 36 -4.71 413 5 6.49 -0.52
2003 KCA 304 -1.89 284 1.06 165 9 51 -3.54 490 10 2.69 -1.68
2003 ATL 310 -1.24 280 2.50 93 6 28 -3.39 467 11 -1.10 -3.22
2003 TOR 283 0.04 324 2.00 63 2 27 -7.63 463 9 1.53 -4.06
2003 COL 309 -2.28 268 -2.06 103 4 41 -9.08 413 7 9.36 -4.07
2003 ANA 300 4.62 308 0.90 188 5 66 -12.13 436 7 2.06 -4.56
2003 BAL 296 -0.33 288 -2.97 129 7 43 -6.49 470 9 5.11 -4.67
2003 BOS 260 -4.72 318 5.07 126 4 39 -4.76 475 7 -0.96 -5.38
2003 DET 301 -0.14 253 4.90 161 3 66 -10.78 356 8 0.41 -5.60
2003 CIN 255 1.63 242 2.24 113 4 38 -8.51 376 12 -1.69 -6.33
2003 PIT 318 1.22 264 -2.47 124 6 43 -7.47 408 7 2.35 -6.36
2003 TBA 296 -3.59 257 -1.34 185 5 47 -1.46 446 12 -0.24 -6.64
2003 SEA 287 -0.03 306 0.61 141 2 39 -1.66 465 9 -6.38 -7.46
2003 TEX 266 -1.65 299 0.28 92 4 29 -4.00 414 11 -2.40 -7.78
2003 FLO 313 2.81 238 1.37 228 6 80 -13.32 420 11 0.27 -8.86
2003 SDN 301 -0.41 292 -3.84 118 3 42 -8.54 438 4 2.66 -10.13
2003 NYA 282 -2.80 317 -2.21 138 10 43 -4.79 449 14 -0.76 -10.56
2003 MON 354 0.08 234 0.34 140 3 42 -6.68 413 10 -4.53 -10.79
2003 ARI 338 -1.46 255 0.98 118 4 42 -6.86 432 9 -3.51 -10.85
2003 MIL 297 2.45 208 1.14 143 5 44 -5.29 383 13 -10.84 -12.54
2003 HOU 293 -1.52 276 -1.23 97 3 33 -5.01 433 12 -5.08 -12.84
2003 CLE 274 -2.84 256 0.39 152 11 72 -19.32 407 6 8.71 -13.06
2003 LAN 306 -0.38 241 -2.85 118 5 41 -7.47 395 6 -2.57 -13.28
2003 SFN 285 -0.38 271 -0.28 90 1 38 -11.56 399 6 -1.48 -13.71
2003 PHI 292 -2.18 254 -1.09 105 5 35 -7.45 427 10 -5.14 -15.85
2003 CHN 301 -2.22 273 1.50 110 8 39 -6.97 409 15 -10.33 -18.02
--------------------------------------------------------------------------------------------
2004 SLN 319 2.59 282 4.46 159 4 51 -5.76 447 6 9.19 10.47
2004 ANA 325 5.08 268 0.57 187 6 52 -0.98 489 13 1.96 6.63
2004 MON 316 2.54 236 -5.13 147 3 41 -0.50 373 4 9.16 6.07
2004 ATL 299 -1.35 228 4.52 119 1 33 -1.72 428 8 -0.51 0.94
2004 TBA 279 -0.30 293 0.31 175 5 47 0.40 398 6 0.06 0.47
2004 SDN 315 3.39 333 -1.91 78 3 28 -6.16 490 9 3.83 -0.85
2004 COL 351 -0.18 249 -1.23 81 4 37 -10.34 445 10 10.16 -1.58
2004 SFN 333 0.74 268 3.67 72 6 29 -9.67 438 7 2.91 -2.36
2004 HOU 319 1.35 277 0.98 114 3 33 -2.13 421 10 -2.57 -2.37
2004 NYA 292 -0.88 272 1.95 111 1 34 -3.93 436 8 -0.60 -3.46
2004 MIL 281 1.11 223 3.28 185 9 49 -2.36 383 7 -6.47 -4.45
2004 MIN 328 0.77 296 -1.32 161 6 52 -7.79 420 8 3.64 -4.70
2004 LAN 311 0.60 243 -2.93 148 7 48 -6.06 397 6 3.54 -4.86
2004 NYN 320 -2.19 240 -1.79 132 3 26 4.47 360 11 -5.79 -5.30
2004 CHA 270 2.59 270 4.21 135 8 59 -15.85 379 8 3.11 -5.94
2004 ARI 302 -0.64 240 -2.65 84 1 33 -7.73 398 5 4.58 -6.44
2004 TEX 225 1.01 290 -1.68 110 5 41 -9.49 422 7 3.65 -6.51
2004 TOR 265 0.69 256 0.94 95 8 39 -8.71 443 10 0.27 -6.80
2004 PHI 315 0.77 269 -1.23 129 3 30 1.95 425 12 -9.30 -7.81
2004 PIT 330 2.56 230 3.39 107 5 45 -14.44 399 6 -0.96 -9.46
2004 CIN 277 0.71 227 -3.01 105 4 29 -1.27 364 10 -6.35 -9.92
2004 BAL 276 -0.28 302 0.65 145 9 50 -12.36 498 14 1.52 -10.47
2004 DET 306 1.24 272 0.81 141 8 58 -12.84 422 10 -0.14 -10.91
2004 FLO 354 -0.74 249 -2.09 142 6 49 -7.75 391 11 -2.36 -12.95
2004 OAK 269 -3.88 286 0.44 72 5 27 -5.97 444 7 -4.15 -13.55
2004 CLE 326 -2.08 312 -3.11 153 7 62 -15.47 466 9 6.28 -14.38
2004 KCA 288 -0.04 280 -3.82 119 6 54 -17.50 424 6 5.52 -15.84
2004 CHN 307 -3.19 287 2.15 102 8 36 -9.08 396 11 -6.55 -16.67
2004 SEA 333 0.00 260 0.46 152 8 50 -8.23 488 10 -9.06 -16.84
2004 BOS 255 -4.67 299 1.12 100 4 34 -6.60 484 12 -14.80 -24.95
--------------------------------------------------------------------------------------------
2005 NYN 289 2.40 246 -2.57 194 8 48 2.60 372 5 6.86 9.28
2005 ATL 313 -1.32 269 0.61 125 3 35 -0.09 392 4 7.99 7.19
2005 TEX 244 -1.71 276 3.58 84 3 18 1.38 402 6 2.68 5.94
2005 TBA 283 -1.66 277 -2.49 201 7 56 -5.33 447 6 12.42 2.93
2005 SLN 308 3.94 253 4.46 118 4 40 -8.83 448 6 2.62 2.19
2005 OAK 259 -2.24 320 -2.58 54 1 23 -5.79 478 3 10.73 0.12
2005 COL 311 1.47 259 1.08 99 4 36 -9.49 449 7 6.58 -0.35
2005 TOR 292 -2.37 257 4.22 106 2 37 -6.94 453 10 2.90 -2.18
2005 DET 285 -4.57 260 5.07 98 6 34 -5.91 445 5 2.26 -3.15
2005 CHA 281 2.35 273 1.58 209 8 75 -10.01 420 11 2.40 -3.69
2005 ARI 310 0.77 249 3.32 97 5 31 -4.97 393 6 -3.59 -4.46
2005 KCA 294 -0.95 293 2.43 97 12 45 -13.78 453 7 7.53 -4.78
2005 SEA 286 -1.30 273 -1.80 150 8 55 -7.79 403 5 5.54 -5.36
2005 CLE 290 -1.82 280 4.30 104 6 42 -12.05 437 7 3.77 -5.80
2005 ANA 321 5.99 265 -2.83 218 5 62 -10.44 474 10 0.99 -6.29
2005 NYA 264 -1.84 294 -0.73 107 5 32 -4.63 485 11 0.53 -6.66
2005 CIN 255 -0.11 242 0.34 104 12 35 -7.22 377 8 -0.01 -7.01
2005 CHN 314 2.97 252 -2.22 111 7 46 -14.03 422 8 5.45 -7.82
2005 MIL 297 0.79 239 -0.82 117 5 39 -6.69 383 12 -2.06 -8.78
2005 HOU 307 0.38 237 3.01 161 6 50 -8.54 413 11 -5.12 -10.27
2005 MIN 329 -1.07 241 -4.78 147 5 49 -4.27 449 7 -1.16 -11.28
2005 BOS 255 -2.03 329 3.64 60 3 15 -0.19 501 7 -12.78 -11.36
2005 FLO 324 1.68 280 1.25 140 6 44 -5.78 447 10 -9.31 -12.16
2005 SFN 360 3.10 259 -5.95 107 7 42 -10.32 440 8 -0.20 -13.37
2005 BAL 295 -2.21 280 3.07 123 7 44 -9.89 436 11 -5.69 -14.73
2005 PIT 287 2.40 265 -4.23 105 5 35 -8.63 458 13 -5.53 -15.99
2005 PHI 302 -1.65 304 -2.37 144 7 34 2.17 447 18 -16.35 -18.20
2005 SDN 298 0.03 297 -1.23 153 12 56 -12.36 427 13 -6.51 -20.07
2005 LAN 312 -3.00 255 0.19 95 4 39 -9.71 396 12 -9.25 -21.78
2005 WAS 326 -0.18 237 0.58 97 10 55 -22.49 392 7 -4.42 -26.50
A quick glance here reveals that most teams are net losers in the world of baserunning almost always because of their negative EqSBR totals. Simply put, teams typically do not gain anything from using the stolen base as a general purpose weapon. It is obviously effective in strategic situations (although the authors of The Book found that disruptive baserunners also cost the batter in terms of overall productivity) but as a general rule most teams would be better off not encouraging the stolen base. For what it's worth the EqSBR numbers here also include busted hit and run plays since there is no way to distinguish them from regular stolen base attempts. EqSBR also includes pickoffs which drags the numbers down as well.
The second part of the article looked at the various metrics in terms of player age to get a feel for how baserunning is affected as players get older. I'll summarize the findings in the following graph that shows each metric and the it's rate by age. EqAAR, EqGAR, and EqHAR are all measured in terms of the rate statistic that was developed while EqSBR is measured in terms of runs per opportunitiy. I've also calcualted the total runs per opportunity across all four metrics which you can see in the green line. The latter two use the secondary y-axis on the right (click on the image to see a larger picture).

The graph reveals what is intuitively obvious: baserunning skills decline with age. Advancing on hits declines the fastest with advancing on ground outs next and advancing on air outs last. EqSBR is more variable with age I would assume since as players age they run in both higher leverage and higher probability situations.
In the column I also looked at total contribution from baseunning (in other words by taking away the average performance in EqAAR, EqGAR, and EqHAR) to approximate how big a part of the offense baserunning is. You'll have to read the column for the details but the short answer is 13%.
Tuesday, September 12, 2006
More Teahen
Also an interesting article by Craig Brown at THT on Mark Teahen that is similar in approach to my column from several weeks ago.
Probably the biggest difference is that Brown indicates that Teahen was pulling the ball more since he came back from Omaha. That tracks with Teahen's own comments and is probably true but the difference was not at all dramatic. To me, the big difference is that Teahen hit many more fly balls this season and he was driving those balls in the gaps and over the fence.
Monday, September 11, 2006
Howard and the MVP
I was taking a look at Ryan Howard and his amazing second half tonight in preparation for a chat tomorrow and created the following chart for the Phillies who now stand 2.5 games out in the wild card.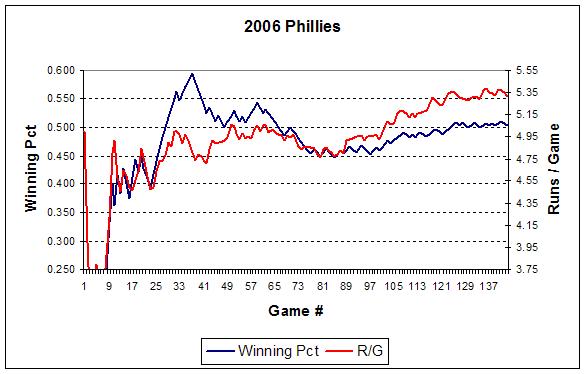
Howard's slugging percentage since the break has been .837. Let me repeat that: eight-thirty-seven. At the break the Phils were 7 games under .500 and were scoring less than 5 runs per game. Since then they've gone 32-24 and have scored just over 6 runs a game. Hard to debate the impact he's had on the team during that time span when they also lost one of their most productive hitters in Bobby Abreu.
Howard is also second in VORP for position players at 74.0 to Travis Hafner's 80.1 making him tops in the NL. Pretty good resume.
Thursday, September 07, 2006
More Baserunning
In a continuation of the baserunning series I've been writing over at Baseball Prospectus this week I renamed my previous metric measuring advancement on hits from Incremental Runs to Equivalent Hit Advancement Runs (EqHAR). This is essentially the same metric published in last fall's Hardball Times Baseball Annual 2006 and discussed in various articles written last summer. I made a few small tweaks this time around.
In addition this week I added up the various metrics I've been playing with in order to provide a more complete perspective on baserunners and baserunning. To that end, here are the top 100 (or so) baserunners in total base running runs in the 2000-2005 period. Note that although the frameworks I've created level the playing field in terms of the situations the runners find themselves in, these are totals and so a higher number of opportunities matters. I've also calculated rate stats that I'll look at next week along with aging patterns and other interesting (to me anyway) topics.
For those not familiar:
                        Opps   EqGAR    Opps   EGAAR    Opps   EQSBR    Opps   EqHAR   Total
Carlos Beltran           126    0.66     169    1.80     204   11.75     253   11.23   25.44
Derek Jeter              218   -0.51     252    6.93     149   10.59     317    8.09   25.09
Johnny Damon             258    1.78     265    3.15     217    9.03     322    9.40   23.36
Rafael Furcal            224    3.17     192    2.58     246    2.76     272   12.09   20.60
Tom Goodwin               90    2.59      83    3.74     147    5.15      97    7.43   18.91
Juan Pierre              279    9.37     204    2.91     378   -8.85     315   15.22   18.64
Tony Womack              201    4.26     178    3.18     219    2.68     224    7.65   17.77
Jimmy Rollins            212    3.49     180    3.28     223    1.69     243    8.62   17.08
Scott Podsednik          126    2.43     103    1.95     227    4.52     132    7.03   15.94
Darin Erstad             176    1.04     195   -2.23     136    4.10     288   11.43   14.35
Chone Figgins            107    4.94      86    2.85     153   -0.59     126    5.72   12.93
Mike Cameron             158   -0.97     166    1.16     179    0.70     188   11.59   12.48
Ichiro Suzuki            246    5.31     229    1.61     248    1.41     309    3.86   12.20
Orlando Cabrera          181    1.25     154   -0.35     135    2.72     207    8.58   12.19
Alex Rodriguez           142    1.94     191    2.06     126    2.35     257    5.52   11.87
Pokey Reese              110    4.22      86    0.63      95    1.88      86    4.99   11.72
Carl Crawford            131   -0.31     116   -2.15     213    8.53     147    5.39   11.46
Ray Durham               196    5.10     230    4.49     147  -10.24     249   11.87   11.22
Craig Biggio             260    0.95     223    2.76      77    3.40     280    2.90   10.02
Jose Reyes                81    1.98      59    2.14     120    1.52      91    4.21    9.86
Roberto Alomar           132    0.36     127    0.15     112    3.30     188    5.69    9.49
David Eckstein           233    3.90     207   -0.86     125   -4.98     280   10.98    9.04
Damian Jackson           106   -0.32      96    0.66     125    1.05     141    7.30    8.70
Dave Roberts             173    2.82     124   -2.05     194    1.74     136    6.07    8.57
Luis Castillo            279    2.47     267   -0.48     278   -8.21     331   14.64    8.41
Cliff Floyd              110   -1.45     141    2.52     102    3.20     196    3.68    7.95
Luis Rivas               113    2.37      93    1.71     104   -0.73     151    4.57    7.92
Eric Hinske              103   -1.52      85    2.63      61    0.79     141    5.84    7.74
Brian Hunter              50    1.69      34    1.41      46    3.29      58    1.33    7.73
Alfonso Soriano          150   -1.08     167    0.50     220    2.54     174    5.76    7.72
Tony Graffanino           87    1.03      97    3.09      48    0.34     127    3.10    7.57
Kenny Lofton             210    2.43     208    0.74     180   -3.06     241    7.35    7.45
Chris Singleton          108    1.21      85    1.42      86   -1.25     112    5.90    7.27
Ryan Freel                80    1.82      73    1.01     113    0.29      78    3.99    7.11
Aaron Rowand              71    0.65      80    0.98      50    1.12     121    4.32    7.07
Delino DeShields          61   -0.33      72   -0.13      84    1.95      62    4.95    6.44
Doug Glanville           120   -0.57     114    1.12     105    5.00     127    0.86    6.40
Michael Young            135    0.21     166    3.12      56   -3.35     226    6.36    6.34
Adam Everett              87    1.24      52   -0.23      55    2.94     118    2.27    6.22
Eric Byrnes               71    0.46      88    0.76      48    2.42     131    2.49    6.13
Aaron Miles               67    2.19      54   -0.08      25   -1.76      79    5.71    6.07
Rey Sanchez              114    0.66     113    2.57      29   -0.62     151    3.37    5.99
Albert Pujols             96    0.16     151    3.56      46   -3.60     226    5.83    5.95
Jason Tyner               67    0.56      32    0.36      58    3.18      74    1.64    5.74
Brian Roberts            138    1.96     144    1.28     136   -2.47     209    4.90    5.66
Marvin Benard             70    2.12      77    1.97      52   -0.37      77    1.86    5.59
Brian Jordan             104    0.00      93    1.94      29   -3.07     126    6.68    5.56
Chuck Knoblauch           88   -0.27      82    0.32      91    0.24     104    5.21    5.51
Torii Hunter             140    0.87     120    0.36     124   -1.73     203    5.95    5.44
Vernon Wells              96   -1.29      92    1.18      44    0.22     148    5.16    5.26
David Wright              48    0.78      40   -0.15      27    0.46      62    4.08    5.17
Jose Valentin            110    0.31     104    3.25      73   -4.87     149    6.31    4.99
Carlos Febles             79    2.39      67    0.47      61   -0.13      97    2.19    4.91
Cristian Guzman          194    1.52     162    2.94     149   -9.96     226   10.36    4.86
Adam Kennedy             206    9.05     147   -1.41     152   -3.67     224    0.82    4.79
Larry Bigbie              56    1.62      71    0.05      34   -1.45     102    4.47    4.68
Eli Marrero              101    2.79      52   -0.24      36    0.48      68    1.60    4.63
Scott Rolen              113   -1.01     168    0.55      63   -2.03     228    7.07    4.58
Willy Taveras             44    1.28      37    1.22      48   -0.66      50    2.68    4.52
Adrian Brown              44    1.78      32   -0.35      30    1.20      39    1.89    4.52
Marcus Giles             103   -0.97     114    2.29      64   -0.60     142    3.79    4.50
Shea Hillenbrand         111   -0.69     138    2.24      21   -0.61     197    3.51    4.44
Willie Bloomquist         40   -0.01      47   -0.17      41    3.15      73    1.41    4.38
Eric Chavez              156   -1.46     159   -0.32      44   -0.78     232    6.91    4.36
Calvin Murray             41    1.21      46    1.05      33   -2.47      51    4.36    4.15
Jeff Bagwell              95   -0.55     147    0.58      62   -0.26     214    4.32    4.09
Barry Larkin              75    1.67      84    0.91      46   -2.34     114    3.80    4.05
So Taguchi                42    1.49      29    0.67      20    0.18      37    1.67    4.01
David Newhan              34    0.64      29    1.27      22    0.58      55    1.51    3.99
Reggie Sanders           114    1.61      88    1.14     136   -1.04     104    2.27    3.98
Reed Johnson              73   -0.46      88    3.65      31   -3.85     144    4.62    3.97
Ramon Vazquez             62    2.13      67    0.11      25   -1.22      88    2.92    3.94
Gary Matthews            138    1.67      93    0.73      75   -3.18     150    4.67    3.89
Gary Matthews Jr.        138    1.67      93    0.73      75   -3.18     150    4.67    3.89
Clint Barmes              28    0.71      17    0.69      11   -1.45      45    3.87    3.82
Ramon Santiago            53    0.60      31    0.25      27    0.00      57    2.97    3.82
Jason Bay                 44    0.53      56    1.15      36    0.57      90    1.41    3.67
Desi Relaford            134    3.30     111   -0.47      83   -0.57     153    1.37    3.63
Edgar Renteria           176    1.47     182   -2.64     164   -3.74     259    8.47    3.56
Nick Green                40   -0.57      42    0.80       7   -0.75      61    4.06    3.54
Omar Infante              71    1.91      55    0.49      38   -0.38      92    1.52    3.54
Jeff DaVanon              54    0.22      58    1.24      63   -2.61      87    4.59    3.44
Stan Javier               36    0.79      39    0.58      16   -0.86      51    2.90    3.41
Wilton Guerrero           41    1.02      36    0.07      24    1.07      36    1.24    3.41
Willie Harris             61    1.48      46    1.60      67   -0.07      60    0.35    3.35
Raul Mondesi              88    0.23     106    2.54     130   -5.75     126    6.25    3.28
Corey Patterson           90    0.40     110    1.68     112   -0.97     111    2.07    3.17
Bo Hart                   15    0.28      21    0.81       4    0.18      25    1.89    3.16
George Lombard            16    0.39      18    0.75      16    1.25      21    0.67    3.06
Kerry Robinson            42   -0.18      45    1.45      46    0.20      50    1.58    3.05
Miguel Cairo             102   -0.44      96   -1.83      73   -0.07     125    5.33    2.99
Chris Stynes              92    0.53      73    0.94      24   -3.03      88    4.53    2.97
Ruben Rivera              58   -0.62      30    0.89      28   -1.87      52    4.52    2.92
Rich Becker               21    0.99      28    0.44       5   -1.38      38    2.85    2.91
Joey Gathright            11    0.53       8    0.41      32    0.73      17    1.18    2.85
Larry Walker              97   -0.09     137    0.61      62   -7.02     215    9.26    2.76
Sunday, September 03, 2006
At Baseball Digest Daily
Joe Hamrahi was kind enough to allow me to answer a few questions for him over at Baseball Digest Daily.
Cubs fans may also want to check out his interview with GM Jim Hendry. My quick take is that it's obvious that the Kerry Wood and Mark Prior situations are the scapegoats for this season and to some degree I suppose that's fair. However, I don't think anyone who has watched the Cubs for the past four or five years is really surprised at how things turned out so you have to put some of the blame for this train wreck of a season at the feet of the front office. In my satirical Setting the Stage piece at BP before the season I said this:
For the third consecutive year the favorite spring pastime for Cubs fans has been to speculate, and sometimes wager, on just when Kerry Wood and Mark Prior would be injured and what those injuries might be. Amid more than half a dozen trips to the disabled list between them and injuries that include right Achilles’ tendonitis, bursitis in the right shoulder, irritation to the ulnar nerve, and inflammation of the elbow joint (and who knows what else), Wood has thrown just 206.1 innings the last two years and Prior just 285.1. That’s about 50% of the production you would hope for from your frontline starters and, the collapse not withstanding, it's what likely kept the Cubs out of the playoffs in 2004.
This spring, if you bet on "posterior rotator-cuff irritation" or a "slow recovery from shoulder surgery and minor knee surgery of the right knee," collect your winnings; both are on the disabled list and out until at least late April.
Ah, but we’re due, and so the Cubs medical staff will work wonders and in 2006 Prior shakes off the rotator cuff problem, comes back in late April and goes 17-4 with a 3.24 ERA striking out 226 batters in 201 innings. Wood returns in early May and still starts 27 games going 16-5 with a 3.66 ERA in 177 innings of work.
It didn't quite work out that way and it didn't take a Nostradamus to think that acquiring pitching depth in the rotation should also have been a priority.
That said, Derrek Lee's injury was clearly devastating but even so the offense was nowhere near good enough to compete (last in the majors in runs scored at 580 and second to last in OBP at .319). Hendry says in the interview that they'll need a quality starter and another hitter to compliment Aramis Ramirez (if indeed he doesn't become a free agent) and Lee. The question is just where will this quality hitter play? Also in the interview he says the "infield has a chance to be really good" with Cesar Izturis, Ronny Cedeno, Michael Barrett, Lee and Ramirez. Leaving aside the huge offensive hole between third and first for the moment, he also says that they'll look at re-signing Juan Pierre. Well, that leaves the corner outfield slots and with Jacques Jones signed for next year already it looks like Matt Murton is the odd man out. I certainly agree they need a quality bat (or actually two) added to the lineup but center and right are where they need to be. Both Jones and Pierre have been about what one would expect - a bit below league average. Pierre is 21st in VORP for centerfielders at 10.6 despite his performance since June 1st. More importantly he is among just five centerfielders with negative MLV values (-10.8). In other words, in a lineup of otherwise league average hitters he would cost the team about 11 runs. Jones ranks 12th of 30 right fielders in VORP at 19.4 and an MLV of 11.1. On the surface this looks ok but he has actually regressed a bit in his strikeout/walk rate which is not encouraging.
Saturday, September 02, 2006
Sickels on Greinke
Many Royals fans have probably already seen this but I thought it was interesting. Sickels charted Greinke's August 19th start in Wichita. I've never been quite as high on Greinke as many others. His pitches simply don't have the movement needed if they're consistently going to be in the high 80s and low 90s. He'll have to rely on pinpoint control to be successful and so he'll always be walking a pretty fine line. That said, it's great to see him back on the mound and being successful. I hope it continues.
Friday, September 01, 2006
A Tale of Two (make that one) Third Baseman
My column on BP this week relates to the article I wrote last year titled "A Tale of Two Third Basemen on Mark Teahen and Sean Burroughs and whether there is a precedent for players like them gaining power as they mature. Well, Teahen seems to be making great leaps and bounds in that direction and so I wanted to take a look at how the turnaround has been effected and whether there is still precedent. In short, there is but Teahen, if he continues hitting at this clip, would be making one of the biggest leaps between his age 23 and subsequent seasons in terms of Normalized Isolated Power (NISO) of any player since 1945.
Here's the complete list of Teahen comparables I found (player who had between 400 and 600 at-bats plus walks before their Age-24 season, who had debuted after the 1945 season, and who had in those opportunities recorded a Normalized ISO between 65% and 100% of league average) and what they did after their age 23 season sorted by NISO.
Name               Bats    Seasons      PA     AVG    SLUG     ISO    NISO
Todd Hundley          B         11    3706   0.239   0.464   0.225   1.477
Tony Batista          R          9    4090   0.251   0.466   0.215   1.341
Dave Duncan           R          7    2560   0.223   0.373   0.150   1.290
Daryl Boston          L          9    2313   0.253   0.425   0.172   1.284
Davey Johnson         R         12    4772   0.262   0.412   0.150   1.269
Mike Sweeney          R          8    4182   0.309   0.513   0.204   1.259
Torii Hunter          R          6    3140   0.269   0.470   0.201   1.242
Dmitri Young          B          8    3900   0.294   0.491   0.197   1.232
Dave Nilsson          L          6    2585   0.291   0.480   0.188   1.188
Nick Johnson          L          3    1218   0.278   0.457   0.179   1.136
Javier Valentin       B          4     614   0.251   0.431   0.180   1.136
Bob Skinner           L         13    4286   0.281   0.428   0.147   1.128
Felix Mantilla        R          8    2467   0.267   0.414   0.147   1.102
Mike Lum              L         13    3463   0.247   0.377   0.129   1.099
Kevin Elster          R         11    2655   0.230   0.389   0.159   1.091
Charley Smith         R          9    2094   0.239   0.374   0.135   1.081
Milton Bradley        B          4    1693   0.281   0.451   0.170   1.074
Manny Jimenez         L          6     568   0.246   0.376   0.130   1.072
Larry Herndon         R         11    4755   0.273   0.414   0.141   1.050
Jerry Morales         R         11    4386   0.263   0.388   0.124   1.045
Jerry White           B          9     922   0.249   0.369   0.120   0.993
Ron Jackson           R         10    2718   0.265   0.394   0.129   0.979
Ray Durham            B         11    6237   0.282   0.439   0.157   0.979
Mike Andrews          R          7    3000   0.257   0.373   0.116   0.978
Jose Castillo         R          1     393   0.268   0.416   0.149   0.975
Marquis Grissom       R         15    8427   0.273   0.418   0.145   0.967
Charlie James         R          4    1039   0.258   0.376   0.118   0.952
Preston Ward          L         10    1825   0.252   0.383   0.131   0.951
Al Woods              L          6    1677   0.267   0.389   0.122   0.913
Don Buddin            R          6    2257   0.241   0.362   0.121   0.900
Derrick May           L          8    1904   0.272   0.404   0.132   0.887
Tony Gwynn            L         18    9547   0.340   0.463   0.123   0.886
Danny Bautista        R         11    2219   0.282   0.421   0.140   0.884
Jerry Mumphrey        B         13    5028   0.291   0.402   0.110   0.882
Dick Green            R         10    3851   0.236   0.341   0.104   0.877
Pete LaCock           L          5    1480   0.267   0.379   0.112   0.874
Frank Bolling         R         11    5620   0.256   0.368   0.112   0.871
Gerald Perry          L         11    3020   0.263   0.375   0.111   0.863
Kenny Williams        R          6     777   0.189   0.299   0.111   0.863
Gene Stephens         L         10    1588   0.240   0.355   0.116   0.862
Chad Curtis           R         11    4035   0.265   0.399   0.134   0.848
George Wright         B          5    1699   0.238   0.355   0.117   0.847
Marvell Wynne         L          8    2480   0.247   0.351   0.104   0.846
Owen Friend           R          5     233   0.206   0.317   0.110   0.838
Jamie Quirk           L         17    2023   0.243   0.352   0.110   0.823
Ben Davis             B          5    1229   0.237   0.370   0.134   0.823
Cap Peterson          R          3     815   0.227   0.321   0.094   0.810
John Hale             L          2     320   0.182   0.288   0.106   0.807
Dale Berra            R          7    2179   0.243   0.347   0.104   0.805
Jerome Walton         R          9    1209   0.259   0.372   0.113   0.801
Julian Javier         R         12    5564   0.258   0.356   0.097   0.801
Gene Richards         L          7    3320   0.290   0.382   0.092   0.787
Benji Gil             R          5    1203   0.248   0.373   0.125   0.776
Jim Sundberg          R         16    6290   0.248   0.349   0.101   0.773
Willie McGee          B         18    7663   0.295   0.396   0.102   0.759
Dave Hansen           L         13    1636   0.271   0.387   0.115   0.746
Ruben Mateo           R          4     445   0.234   0.351   0.117   0.743
Jerry May             R          7    1233   0.221   0.306   0.085   0.726
Hosken Powell         L          5    1534   0.262   0.353   0.091   0.682
Russ Nixon            L         11    2072   0.260   0.346   0.086   0.666
Rafael Ramirez        R         11    5260   0.263   0.344   0.081   0.662
Rick Burleson         R         12    5154   0.272   0.360   0.088   0.659
Fred Kendall          R          8    2326   0.242   0.319   0.078   0.651
Len Randle            B         10    3821   0.264   0.342   0.077   0.630
Chris Gomez           R         13    3979   0.257   0.355   0.098   0.618
Luis Polonia          L         16    4742   0.293   0.382   0.088   0.612
Matty Alou            L         14    5673   0.307   0.378   0.071   0.600
Dave Anderson         R          8    1686   0.245   0.319   0.074   0.599
Elliott Maddox        R          9    2655   0.267   0.337   0.070   0.588
Brent Gates           B          6    1963   0.257   0.347   0.090   0.559
Paul Smith            L          3     191   0.243   0.318   0.075   0.528
Todd Dunwoody         L          4     454   0.211   0.297   0.086   0.526
Carlos Febles         R          4    1290   0.244   0.328   0.083   0.512
Scot Thompson         L          7     969   0.245   0.304   0.059   0.508
Wally Backman         B         10    3118   0.276   0.337   0.062   0.491
Phil Gagliano         R         10    1104   0.236   0.293   0.058   0.488
Kevin Bell            R          2     229   0.185   0.250   0.065   0.485
Tom Umphlett          R          2     706   0.218   0.268   0.050   0.415
Jose Valdivielso      R          3     460   0.209   0.248   0.039   0.293
Tucker Ashford        R          4     112   0.158   0.188   0.030   0.235
Rick Sofield          L          1     110   0.176   0.196   0.020   0.168
Dave Hilton           R          1       8   0.000   0.000   0.000   0.000
Brandon Phillips      R          1       9   0.000   0.000   0.000   0.000
Donnie Scott          B          1      19   0.158   0.158   0.000   0.000
Honoring Baseball History in Denver
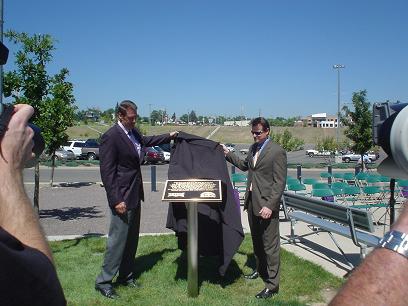
Although work commitments precluded my attendance I wanted to mention that the Rocky Mountain Chapter of SABR and the Rockies held a ceremony earlier this week on Tuesday to commemorate Denver's baseball history. Led by chapter president Neal Williams and including Jim Burris and the son and grandson of Bob Howsam (who built Bears Stadium back in 1948) they unveiled a plaque near Invesco Field commemorating old Bears Stadium/Mile High Stadium, which housed professional baseball in Denver from 1948 to 1994. There were also representatives from the Rockies at the event including Paul Parker SABR member and Rockies club historian as well as Keli McGregor. 
In addition, a home plate was placed in the exact spot that it occupied at the old ballpark. Apparently the home plate was a big hit and was located by local hisorians who worked with the city to obtain old photos and use GPS to pinpoint the spot.
From Thomas Harding's piece on MLB.com.
"Bears Stadium opened in 1948 with 17,000 seats, and it expanded on several occasions -- first to attempt to attract a Major League franchise, with football being added to the list of priorities in later years. The city of Denver bought the park and renamed it Mile High Stadium in 1968.
The Triple-A team was known as the Denver Zephyrs from 1985 to 1992. The Rockies fulfilled Colorado's Major League dreams and played at Mile High, which had grown to more than 76,000 seats, in 1993 and 1994 before moving into Coors Field in 1995."
125x125_10off+copy.jpg)


