
I missed this article by Tom Tippett of Diamond Mind on the results of preseason divisional rankings. Using their methodology borrowed from Pete Palmer I came out solidly in the middle with a score of 54. Congrats to Jonah Keri who placed 10th with a score of 44.
Tuesday, November 28, 2006
Sunday, November 26, 2006
Quick Takes Post Thanksgiving
Two items of interest I ran into this evening while getting ready for the post-holiday week.
Saturday, November 25, 2006
MVP Controversies
So the MVPs are in and as usual we've got lots of controversy. For my part, I think the selection of Ryan Howard in the NL is at least a defensible one.
Yes, Jim Baker did a nice job in breaking down the statistical argument and showing that while Howard and Pujols were matched offensively (85.4 to 81.5 in VORP, .346 to .337 in EqA in Pujols' favor), Pujols' defense puts him over the top in WARP 11.9 to 8.6. And yes, the voters picked the top three in reverse order of RBI which Dayn Perry rightly derides. But still, the selection of Howard is less controversial in my eyes since he did in fact lead a second half surge that got the Phillies on the cusp of the post season (Joe Sheehan also disagrees). Clearly he was an extremely valuable player as was Pujols. It's also good for baseball to have a new face capture the award and let's face it (warning: Cubs fan rant) Pujols shouldn't have gotten the award over Derrek Lee last year anyway so he was due for a snub :)
But the selection of Justin Morneau is more problematic, not necessarily because of the outcome but because in that outcome the weakness of the process was on display for all to see. As some have argued, Morneau was perhaps the fourth most valuable player on the Twins when you consider the key defensive positions played by Torri Hunter and Joe Mauer. What's more interesting to see, however, is the actual votes that were cast in the AL race and how Joe Mauer was left off of five ballots altogether. One can argue whether or not Johann Santana should be considered but Mauer, at a tougher defensive position, I would have thought would split the vote thereby allowing Derek Jeter to sneak in. I've also heard discussed the possibility there might be an anti-New York bias but I can't see how that's the case given that Alex Rodriguez won the award last season.
In the final analysis I do like that performance rankings aren't a mandated part of the MVP selection process and that there is room for the voters to consider a whole host of factors that quantitative analysis would miss. But leaving players of the quality of Mauer off the list and instead including A.J. Pierzynski as happened in once case simply boggles the mind. Clearly what needs to happen is to open the voting to a much wider audience in the hopes that the wisdom of crowds will make better reasoned choices. Fourteen people who essentially possess no special qualifications is just too small a group to not lay an occasional egg.
Wednesday, November 22, 2006
Rockwell Automation
Here's a hilarious post and comments section. Cub fans will no doubt find something in it.
Tuesday, November 21, 2006
Chat Transcript 11/21
Thanks to everyone who participated in the chat today. Feel free to add to the discussion here and I'll do my best to chime in.
Monday, November 20, 2006
The Physics of the Curveball
I received this interesting article from my father-in-law related to the physics of baseball from the August 13, 1883 edition of The New York Times. It reads:
THE CURVE BALL
From the Lancaster Penn. New Era Aug 11
Under the new method in base-ball many players have become adept at pitching what is styled the "curve" ball, delivering the ball toward the batter at what he regards the desired height but which, when nearing the home plate, through the power of a curve or twist given it by the pitcher, either drops or goes up or out from the plate, puzzling the batsman, and often preventing him from hitting the ball at all. Mr. Robert J. Houston made an offer of $10 to any person would accomplish a test experiment which he would give him. The challenge was accepted by Hofford, the Ironsides pitcher, and Mr. Houston, accompanied by a number of friends and Messrs. Hensel, of the Intelligencer, Pyott and Allen A. Gerr as judges repaired on Friday afternoon to the rear of the Lancaster cemetery to have the vexed question settled. The test prescribed was to pitch a ball on the opposite sides of three posts placed in a straight line, the one 25 feet from the first and the other 22 1/2 feet from the second; in other words, to pitch the ball on the left side of the first, the right side of the second, and left side of the third, describing a snake-like action and proving the existence of the curve. For a number of attempts Hofford failed to get the ball to curve from the second post to the proper side of the third, the ball frequently striking the second post. Finally he got it around to hit the third post, and with a few more efforts accomplished the task to the satisfaction of everybody present. Mr. Houston promptly handing over the reward.
Of course the question of just who invented the curveball has been the subject of some debate with the two most prominent figures being Candy Cummings, who claimed he thought of the idea in 1863 as a boy watching thrown clam shells curve, and Fred Goldsmith who made the first public demonstration of the curve on August 16, 1870 some 13 years before this article and using the same experiment. While it seems interesting at first that the question was still an open one over a decade after it had been shown, keep in mind that the question was still being debated in the 1930s and 40s and it wasn't until 1959 that Lyman Briggs, using wind tunnel experiments, showed scientifically that the ball curves and how far.
But what's interesting is that Briggs' experiments, and as discussed by Robert Adair in the book The Physics of Baseball, showed that a curve ball only deviates from the straight line drawn from the pitcher's release point to the point at which it crosses the plate by around 3.4 inches (when viewed from above) and all the while moves in a smooth arc. This is the reason that Hofford the pitcher had such difficulty in getting the ball to get around the second post. There simply isn't much margin for error in trying to throw a ball that is a shade under 2.9" in diameter. However, as seen from the pitcher's and batter's perspective the ball curves some 14 to 17 inches with half of the deflection coming in the last 15 feet or so. This is why Hofford, once he was able to traverse the second post, had an easier time with the third. Interestingly, as Adair says, "neither the smooth arc nor the break is an illusion but a different description of the same reality."
Chat Tomorrow
Just a reminder that there is a chat scheduled with yours truly on BP tomorrow at 11AM Mountain Time/1 PM Eastern. It works better for me if you can get your questions in early. See you then.
Friday, November 17, 2006
Numb3rs
I assume some of you caught last Friday night's episode wherein a 25 year-old high school dropout and fantasy league champion sabermetrician detects steroid use. Well. I've tried to be a fan of the show but haven't been able and this episode was no exception. I did write about it and The Science Channel program "Baseball's Secret Formula" this week on BP so you can check that out.
As far Numb3rs was concerned, did appreciate our hero the math professor noting that sabermetrics "really is a powerful form of analysis," and, in a voice-over companied by some nice graphics, he continued:
The physical nature of the game involves chance. So the difference between a hit and out could be millimeters or milliseconds. So when you have athletic situations involving chance repeated over and over again, a statistical analysis can isolate and reveal human performance.
Nice. Much of the rest wasn't however.
Tuesday, November 14, 2006
Yes, More Gyroball
SABR member Alan Nathan who is a Professor of Physics at the University of Illinois has weighed in on the physics of the gyroball. According to many published reports like the CBS news story I linked to a while back, the pitch would have a sharp break away from right-handed hitters when thrown by a right-handed pitcher.
Nathan, however, disagrees and using figures given to him by Dr. Ryutaro Himeno, the Japanese computer scientist who discovered the gyroball, shows that the pitch would much more likely behave like a split-fingered fastball since a "pure gyroball" would have no backspin and therefore no lift as does a regular fastball. It would, however, have a very small amount of break away from a right-handed hitter.
However, Nathan also includes two additional models for gyroballs with slightly different spin axes and these wouldn't have as much downward break because of more backspin but the "gyroball with side force" would behave much like a cut fastball but with more drop. This may be why Al Leiter in the CBS piece said the pitch looked like a cut fastball.
Monday, November 13, 2006
Helton Fouls 'em Off
Baseball fans love foul balls.
I'll have to admit however that despite having attended a couple hundred major league games I've never myself caught one. The closest I ever came was a game at Turner Field, when sitting in the loge section just to the first base side of home plate in the first row, a foul ball flicked off my oustretched fingers as I leaned down towards the field. Oh, and I was also almost killed by an Andre Dawson line drive at Wrigley Field but that doesn't really count since I was attempting to catch that one and was instead cowering behind my seat down the third base line.
In any case, I'll bet you're all wondering what players hit the most foul balls in 2006. Wonder no more. The top 20 are.
Name                 Fouls   Pitches    PA    F/PA     F/P
Todd Helton            563    2553     649   0.867   0.221
Grady Sizemore         556    3014     751   0.740   0.184
Alfonso Soriano        537    2840     728   0.738   0.189
Michael Young          534    2802     748   0.714   0.191
Chase Utley            528    2927     739   0.714   0.180
Matt Holliday          517    2413     667   0.775   0.214
Jeff Francoeur         513    2277     686   0.748   0.225
Derek Jeter            503    2691     715   0.703   0.187
Brian Roberts          497    2419     630   0.789   0.205
Adrian Beltre          494    2572     681   0.725   0.192
Carl Crawford          493    2314     653   0.755   0.213
Carlos Guillen         476    2372     622   0.765   0.201
Adrian Gonzalez        475    2460     631   0.753   0.193
Magglio Ordonez        474    2286     646   0.734   0.207
Chad Tracy             473    2649     662   0.715   0.179
Johnny Damon           472    2743     671   0.703   0.172
Hanley Ramirez         470    2798     700   0.671   0.168
David Wright           468    2601     661   0.708   0.180
Kevin Youkilis         463    3004     680   0.681   0.154
Vladimir Guerrero      461    2101     665   0.693   0.219
Personally, I'm not surprised that Todd Helton takes the top spot. Helton missed 14 games in late April and early May to what was diagnosed as "acute terminal ileitis". He then perhaps pushed himself too hard and played in 48 straight games upon his return never really regaining his form. In watching him in it certainly appeared as if his timing was a bit off thereby fouling off a tremendous number of pitches. Note that you see other free swingers in this list including Helton's teammate Matt Holliday, Alfonso Soriano, and uber-free-swinger Jeff Francouer.
I'll bet you also didn't know that Ronny Cedeno fouled off 14 of the 27 pitches in 4 plate appearances against Fernando Nieve thereby taking the top spot in fouls per plate appearance.
As far as pitchers are concerned here are the top 20 in fouls per plate appearance.
Name                 Fouls  Pitches     PA    F/PA     F/P
Jonathan Papelbon      258    1023     257   1.004   0.252
Rafael Betancourt      227     899     231   0.983   0.253
Russ Springer          223    1008     240   0.929   0.221
David Aardsma          208     962     225   0.924   0.216
Neal Cotts             230    1031     251   0.916   0.223
Rafael Soriano         215     981     241   0.892   0.219
Scott Baker            327    1441     377   0.867   0.227
Bob Howry              271    1298     314   0.863   0.209
Jose Valverde          188     924     223   0.843   0.203
Jason Frasor           180     932     215   0.837   0.193
Curt Schilling         696    3244     834   0.835   0.215
Mariano Rivera         244    1101     293   0.833   0.222
Chris Young            610    3025     735   0.830   0.202
Scott Proctor          353    1594     426   0.829   0.221
John Maine             300    1511     365   0.822   0.199
Jonathan Broxton       262    1305     320   0.819   0.201
J.J. Putz              248    1215     303   0.818   0.204
Jeremy Accardo         243    1217     297   0.818   0.200
Billy Wagner           242    1242     297   0.815   0.195
Alan Embree            180     823     221   0.814   0.219
Not sure what this means if anything other than perhaps pitchers with hard breaking stuff induce more fouls.
Scouting with SABR
Last Saturday night was the annual banquet of the Rocky Mountain SABR chapter and my wife and I were in attendance with approximately 75 other baseball fans. Last year was the first I had attended and like last year the event was a great deal of fun and the speakers entertaining.
Like last year the dinner was held at the Denver Athletic Club in downtown Denver and right down the hall from a large crowd at the Denver Sailing Association.
The evening got underway as Paul Parker, treasurer and Rockies club historian and manager of the "community fields" program, introduced Keith Bleyer who served as the MC for the evening. Keith servers as the roving reporter on Fox Sports Rocky Mountain telecasts of Rockies games. After reports from Parker and Neal Williams the chapter president while we enjoyed our dinners, Bleyer introduced the first speaker, Matt Vinnola, who manages the professional scouting organization for the Rockies.
Matt spoke for about 20 minutes and in that time took the crowd through a typical season in the professional scouting department starting with the end of the season and running through the crescendo of his work - the July 31st trading deadline of the next season. Matt manages 10 people including several former managers such as Marcel Lachemann and other scouts whose job it is both to scout all of the other team's existing players as well as the Rockies organization. Although he lost some of the crowd in his explanatin of article 19 versus article 20 free agents and other rules of availability, he provided a great deal of information in a short period of time. Essentially Matt's job is to consolidate information from his scouts as well as supplementing that data with the MLB's scouting bureau in order to do things like maintain the 40-man roster boards on all 30 teams, create a top 20 prospects report on all the teams, and provide input on which teams are likely to re-sign players and go after particular free agents. All of this information is then fed to the decision makers in GM Dan O'Dowd and Assistant GM Bill Geivett.
Over the course of last season Matt estimated he read upwards of 9,000 reports on various players and while he admits he's not a scout, he's conversant enough in the language and has read enough reports to be able to pour through them and filter the necessary information. Actually, he said if he were a scout he'd be a "3-5-7" scout meaning that on the 8-point scouting scale he can look at a player and see if he's not very good, a decent player, or really good. The subtleties of arm angles and motion repeatability are more difficult and feed into the finer distinctions drawn by professional scouts. He also noted that's not a stranger to doing a bit of statistical analysis himself and shared an interesting factoid - the Rockies in 2006 were second in all of baseball behind only the Yankees in run scoring in innings 1 through 6 but dead last from the 7th inning on. He didn't speculate as to why this might be the case however. And he also mentioned that while of course the information from his scouts is treasured, he also scours the internet looking at STATS and other sites to provide as complete a picture as possible.
At the end of his talk he fielded a few questions and when asked about performance enhancing drugs, he was quick to point out that while he thinks evaluating players (pitchers too) with potential PED issues is among the biggest challenges, the data he's looked at hasn't shown the drastic decline that he would have expected. He answered several other questions including one the likelihood of scouts in the hall of fame (he's all for it not surprisingly) and in all his talk was enthusiastically given and very well received.
After Bleyer entertainingly played auctioneer in the auctioning off of an autographed Rockies bat ($180) and "A League of Their Own" movie poster ($425) autographed by Tom Hanks and Madonna among others Thomas Harding of MLB.com and the "feeling good feeling clean" report on MLB radio gave the keynote address. Harding talked about his career from his humble beginnings in Bluefield West Virginia to his days in Memphis and finally his opening with the Colorado Springs Gazette that has since led him to Denver. He told several interesting anecdotes but probably the most entertaining was his first experience in covering a major league game in Atlanta in 1983 while still a college student. Failing to ask manager Joe Torre his question at the right time, he hung around afterwards and summoned the courage. Torre immediately asked him when he graduated and proceeded to allow the young reporter to ask his questions while he shaved. From there Harding was hooked.
The evening ended with the closing of bids on various items including baseball books and cards. Yours truly snagged a copy of Saving the Pitcher by Will Carroll and I'll admit to having outbid the keynote speaker. President Williams also awarded SABR memberships to Bleyer and the two speakers. Once again a very entertaining evening in the fellowship of other baseball fans (sponsored I might add by the Rockies organization). What's not to like?
Wednesday, November 08, 2006
Quick Takes
In the middle of a week it's always a good time to put in a few quick takes.
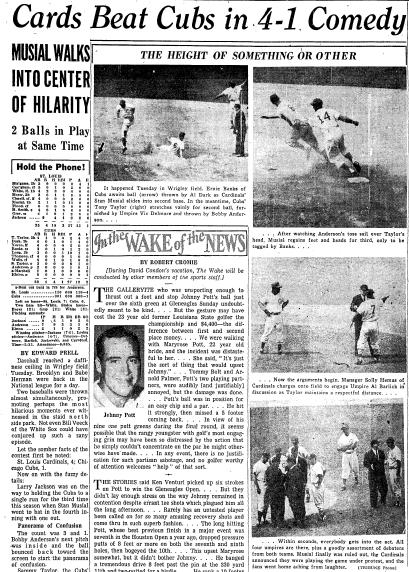
As related in the aricle, with Stan Musial up with one out in the fourth and the count 3-1 the pitch from Bobby Anderson got away from the catcher Sammy Taylor and bounced back towards the screen. Taylor, instead of retrieving the ball, started arguing with home plate umpire Vic Delmore over whether the pitch was actually fouled. Musial of course had trotted to first and when he noticed that neither Anderson nor Taylor was seemed interested in the ball, he took off for second. In the meantime Alvin Dark, playing third, raced for the ball which was picked up by the bat boy. Dark intercepted the ball however as the bat boy was tossing it to the field announcer. About this same time Anderson was given a new ball by Delmore and when he saw Musial almost at second, he threw to to second as did Dark. Luckily for the Cubs Anderson's throw sailed well over the bag and Musial, seeing this rounded the bag while Dark's throw was a one hopper that Ernie Banks, covering from short, caught and used to apply the tag to Musial for the out. The Cardinals of course argued and ultimately played the game under protest. The Retrosheet game log desscribed it thusly:
CARDINALS 4TH: Cimoli grounded out (shortstop to first); Musial walked; The fourth ball to Musial rolled to the stands. Dark chased it down and threw to secondbase to Banks who tagged Musial.Meanwhile umpire Delmore at the plate handed a new ball to Sammy Taylor who threw it into CF as Musial continued to third. After a long argument the umps decided the original ball was in play and that Musial was out. The Cardinals then played the game under protest; H. Smith singled to shortstop; Gray struck out; 0 R, 1 H, 0 E, 1 LOB. Cardinals 2, Cubs 1.

What was most interesting was this excerpt:
"Puffing compulsuively on a cigarette and with tears streaming down his face, he brushed aside the hand of the official scorer Charlie Park of the Los Angeles Mirror-News, when the baseball writer tried to explain why he called Jim Gilliam's roller to short in the eighth a hit."
"'I don't think it was a hit whatever you may have called it,' sobbed Jones as he literally pushed aside Park....Park said he called the ball, which went to shortstop Andre Rogers, a hit because he thought the fleet Gilliam would have beaten it out even on a perfect play. Park said: 'I'm sorry Sam, but if I had to call it again I'd have called it a hit'"
As I mentioned in a column a few weeks back on scorers, the practice of having reporters act as scorers was stopped in 1980 and in this case it seems pretty clear that Park, in trying also to write a story about the game, has a bit of a conflict on his hands if he wants to maintain a good relationship with the players. One wonders whether Park is saying that on second thought in his judgement it really was a hit or if under the circumstances he would call it an error to preserve the no-hitter.
This story raises the question of just when it was determined that scoring decisions could be changed up to 24 hours after the game. In this case it looks as if the decision was final.
This also gives us the opportunity to mention a recent study published in the Journal of Quantitative Analysis in Sports called Baseball Errors by David Kalist and Stephen Spurr. This paper was also briefly reviewed by Phil Birnbaum on his sabermetric research blog. Although they also investigate the issue of scorer bias, the authors find not surprisingly, that the error rate per game has steadily decreased over time likely owing to better equipment and better field conditions (they also considered rule changes in 1955 and 1967 related to slow handling and mental mistakes but didn't consider them relevant) and also that the error rate is statistically significantly higher in the National League than the American League. This they assumed could be attributed to speedier players in the NL historically that force fielders to rush their throws etc. resulting in more errors. That didn't turn out to be the case when they used stolen bases per game as a proxy for steals and so instead chalk it up to "lower standards" by official scorers in the AL, a conclusion that to me anyway seems implausible. Of course, off the top of the my head I can't think of a better reason and would have at first thought that the DH in the AL meant that the NL had fewer quality fielders as older players (Barry Bonds, Mike Piazza) are forced into the field. However, their study of rates both before and after the introduction of the DH indicates that this is not the case.
When they then analyzed the data for bias they also found that error rates are significantly (statistically) higher in March and April and then settle down and that an opposing team's speed is also significant although again it doesn't explain the differences between the leagues. Finally, they did in fact find some evidence for home team bias but that the effect has declined since 1976 and attribute this to the removal of reporters from the position of official scorer and the advent of arbitration and free agency which has increased the stakes for the players.
Now it seems to me that this analysis, as the authors admit, doesn't really tell us much in regards to scorer bias since if there is bias it would typically result in fewer errors called on the visiting team (since the scorer would be more likely to award hits to the home team and the opposing forces of not attributing errors to home team fielders and not wishing to charge a home team pitcher with earned runs would to some extent cancel each other out). Unfortunately, it's probably also the case that players field better at home and so it would be difficult with this methodology to determine which factor has more potency.
For my money a more fruitful approach is to look at individual scorers assuming you have enough data since it's likely that if there is bias it will be much easier to spot in individuals than in the entire group. The data I showed in my column is a first attempt this.
Monday, November 06, 2006
Rain, Rain, Go Away
Last week my column on Baseball Prospectus included discussions of both postponements from an historical perspective spurred by the rainouts during this most recent post season coupled with one solution: bring back the regularly scheduled doubleheader.
The data for postponements was provided by fellow SABR member Paul Rivard who kindly shared the information he has collected and gave me permission to publish it. As I shared in the column:
"To summarize, Paul has access to both original and as-played schedules in a spreadsheet. He then uses the online service ProQuest to sift through the New York Times baseball section for each of the 170 or so days of the season and identify which games were actually postponed. Easier said than done, I'm sure. By indicating the postponements in his Excel files he can then run basic queries to calculate the percentage of games that were postponed. As a SABR member Paul has, for the time being, access to ProQuest through his membership. Unfortunately, that organizational access expires at the end of the year, so he's busily working his way through as many seasons as possible.
As Paul mentioned to me in an e-mail, this data is preliminary, and there are bound to be small revisions in the numbers once he has more time to comb through the data in detail. For example, complete results will also include make-up games that were once again postponed. Of course, these shouldn't significantly change the numbers, but keep in mind that this is a bit of a work in progress. In addition, this data will also be combined with that from other SABR members and should eventually be made available on Retrosheet as part of the Game Schedules effort."
Since the publication of the article which included data from 78 seasons including 1926-1955 and then sporadic years up to 2004, Paul has sent data for both 1925 and 1956. He's also done some more digging into 1949 and found that although there were 1232 games originally scheduled, there were a total of 1316 games played or intended to be played during that season. For that season 76 were postponed which results in a postponement rate of 5.78% (76/1316). The preliminary figure, which is what I shared in the column and will show in the graph below, results in a figure of 5.76% (71/1232). So the difference from a rate perspective is likely not significant meaning that the numbers you see in the graph below are illustrative of the overall trends.
For kicks, here is how 1949 worked out (from an email from Paul):
Putting that together equals 1316 games (1232+8+71+1+4) which were played or were intended to be played. The total postponements were 76 (71+1+4).
As for the overall trend the graph below shows the data points Paul has provided along with a best fit exponential trendline.

As you can see, in the 1920s postponements were around 10-13% and that number has steadily declined to around 2% for 2004. There are a number of reason why this is the case and SABR members had some discussion of the topic when Paul originally shared this data several weeks ago. The most popular, though, included better grounds keeping (fields that drain better), the introduction of lights (allowing scheduled day games to be played, especially after 1950), geography (a greater percentage of the game being played on the west coast where it rains less), and stadium construction (domed and retractable roof stadiums along with artificial turf). All of these I go into in a little more detail in the column but of course the happy result is that 98% of the time you pack your family in the car, pay for parking, and shell out oodles of money for hot dogs and Dippin' Dots, you'll see baseball played.
Paul also shared that indeed the ultimate goal is for this data to find its way into the Retrosheet game logs to provide a full record of how each major league season unfolded. And what more could any baseball fan really want?
Subscribe to:
Posts (Atom)
125x125_10off+copy.jpg)


