FREE hit counter and Internet traffic statistics from freestats.com

Saturday, December 16, 2006

An Historical Look at EqSBR

Last week in my column at Baseball Prospectus I ran down the leaders and trailers in Equivalent Stolen Base Runs (EqSBR) that I wrote about this summer. Although the name includes the words "stolen base" the measure also encompasses straight pickoffs.

Simply put, the methodology used relies on run expectancy (RE) tables and is more granular than a simple weighting of each stolen base and caught stealing, for example, by considering the base/out state in which the stolen base attempt or pick off occurred. In other words, if a runner steals third with two outs they'll receive less credit than a runner who steals third with one out on the basis that with one out the gain in potential runs outstrips that with two outs since the runner is more likely to score via a sac fly or ground out. Of course, this doesn't take into consideration the game state (score, inning) and for that we would need to use Win Expectancy (WX), but it does reveal something about the stolen base as a general offensive weapon as opposed to only a strategic one. The measure also does not include the backend of double steals.

In addition, the column this week contains the team totals for 2006. San Diego (+2.76), Baltimore (+1.99), Philadelphia (+1.16), and the Mets (+0.61) were the only teams to keep their heads above water while Florida sank to the bottom at -15.98. As as an aside I've updated my Balls in Play Chart (BIPChart) software as discussed on the new and very informative (this author excepted) Unfiltered blog at BP.

While answering a query from Matt Phillip at Fungoes.Net I ran the EqSBR program for all seasons (except 1999) from 1980 through 2006 (the computer chunked away for a little over 4 hours while we were out at my daughter's basketball game and delivering gifts). Listed below are the individual seasons of more than +5.00 followed by those at -4.00 or less. Of the 12,316 individual season totals that were calculated 8,195 or 67% came out less than zero. As you might imagine the top 19 values are from the decade of the 1980s.


Year Name Team Opp PO CS EqSBR
1980 Ron LeFlore MON 119 3 19 14.37
1980 Willie Wilson KCA 90 1 10 13.75
1983 Rickey Henderson OAK 132 5 19 13.71
1984 Tim Raines MON 85 0 10 13.49
1983 Tim Raines MON 110 6 14 13.31
1983 Rudy Law CHA 90 1 12 13.19
1988 Rickey Henderson NYA 110 4 13 12.34
1986 Vince Coleman SLN 130 9 14 11.91
1985 Tim Raines MON 80 1 9 11.79
1986 Eric Davis CIN 93 2 11 11.45
1985 Vince Coleman SLN 140 5 25 11.43
1985 Rickey Henderson NYA 93 4 10 10.95
1983 Willie Wilson KCA 67 0 8 10.82
1986 Tim Raines MON 79 2 9 10.67
1982 Tim Raines MON 94 0 16 10.43
1981 Tim Raines MON 84 2 11 9.74
1987 Vince Coleman SLN 140 9 22 9.73
1984 Juan Samuel PHI 89 2 15 9.33
1991 Marquis Grissom MON 93 0 17 8.89
1987 Tim Raines MON 56 1 5 8.62
1987 Willie Wilson KCA 68 0 11 8.59
1985 Gary Pettis CAL 67 2 9 8.47
1980 Jerry Mumphrey SDN 53 0 5 7.99
1992 Marquis Grissom MON 96 5 13 7.97
1991 Otis Nixon ATL 94 1 21 7.60
1984 Willie Wilson KCA 52 0 5 7.50
1992 Tim Raines CHA 48 0 6 7.20
1990 Rickey Henderson OAK 81 6 10 6.99
1985 Davey Lopes CHN 49 1 4 6.94
1983 Al Wiggins SDN 84 5 13 6.91
1985 Ryne Sandberg CHN 62 0 11 6.82
1990 Vince Coleman SLN 98 4 17 6.74
1986 Rickey Henderson NYA 111 6 18 6.47
1989 Vince Coleman SLN 81 6 10 6.37
1982 Rickey Henderson OAK 174 4 42 6.19
1988 Vince Coleman SLN 110 2 27 6.16
1988 Ozzie Smith SLN 59 0 9 6.14
1988 Barry Larkin CIN 47 0 7 6.12
1987 Gary Redus CHA 64 1 11 6.09
2006 Ichiro Suzuki SEA 47 1 3 6.03
1980 Dave Collins CIN 106 6 21 5.89
1982 Al Wiggins SDN 39 0 6 5.82
1983 U L Washington KCA 49 2 7 5.72
1981 Julio Cruz SEA 52 1 8 5.69
1992 Roberto Alomar TOR 58 1 9 5.66
1992 Pat Listach MIL 70 0 18 5.65
1993 Kenny Lofton CLE 84 1 14 5.58
1983 Mookie Wilson NYN 72 2 16 5.56
1980 Omar Moreno PIT 134 6 33 5.54
1982 Paul Molitor MIL 50 0 9 5.52
1989 Rickey Henderson OAK 61 4 6 5.52
1986 Bob Dernier CHN 29 0 2 5.42
1987 Paul Molitor MIL 57 2 10 5.38
1988 Paul Molitor MIL 51 0 10 5.33
1984 Mookie Wilson NYN 55 2 9 5.27
1984 Rickey Henderson OAK 85 1 18 5.26
1992 Devon White TOR 41 0 4 5.25
1980 Ozzie Smith SDN 71 1 15 5.24
1984 Gary Redus CIN 63 4 11 5.23
1988 Eric Davis CIN 37 0 3 5.20
1982 Mookie Wilson NYN 76 2 16 5.16
1990 Barry Bonds PIT 66 1 13 5.07
1980 Gene Richards SDN 79 2 16 5.05
1985 Gary Redus CIN 60 0 12 5.01
2000 Eric Young CHN 60 1 8 5.00


And now all of those with an EqSBR of less than -4. Note that Kenny Lofton and Will Clark took the top two spots by a wide margin. Lofton's dismal showing in 1997 was primarily the result of getting caught stealing twice at home. The first time he took off as the catcher attempted to cut down a runner moving from first to second and was subsequently thrown out in a rather odd 2-6-1-2 play. The second time a runner was picked off first (1-3-4) and then Lofton was thrown out trying to take home 4-2 for a double play. Each of those plays were debited at -1.29 for -2.58 total.

Year Name Team Opp PO CS EqSBR
1997 Kenny Lofton ATL 50 3 20 -9.39
1987 Will Clark SFN 22 0 17 -7.46
2004 Juan Pierre FLO 73 4 28 -6.61
1993 Craig Biggio HOU 32 0 17 -6.45
1983 Steve Henderson SEA 26 3 14 -6.39
2005 Brad Wilkerson WAS 19 2 12 -6.23
1992 Greg Vaughn MIL 32 4 15 -6.21
1993 Ray Lankford SLN 29 3 14 -6.03
1980 Alfredo Griffin TOR 42 2 23 -6.03
1994 Jose Vizcaino NYN 12 0 11 -5.97
1988 Harold Reynolds SEA 64 2 29 -5.94
1995 Chad Curtis DET 47 5 15 -5.81
2004 David DeJesus KCA 21 2 13 -5.77
2003 Luis Castillo FLO 40 1 20 -5.77
1995 Vinny Castilla COL 10 1 8 -5.72
1993 Luis Polonia CAL 83 4 24 -5.58
1993 Ryan Thompson NYN 12 3 7 -5.49
2001 Vladimir Guerrero MON 52 2 18 -5.40
1984 Tony Bernazard CLE 36 3 13 -5.38
2004 Juan Uribe CHA 21 2 13 -5.33
1994 Felix Jose KCA 26 4 12 -5.30
1997 Bernard Gilkey NYN 20 2 11 -5.18
1995 Otis Nixon TEX 76 5 21 -5.16
1993 Darryl Hamilton MIL 34 2 13 -5.15
1994 Greg Gagne KCA 27 0 17 -5.12
1998 Fernando Vina MIL 26 3 11 -5.11
1998 Tony Fernandez TOR 22 2 8 -5.09
1997 Jose Offerman KCA 18 1 9 -5.08
2003 Jose Cruz Jr. SFN 13 0 8 -4.98
2006 Jamey Carroll COL 25 3 15 -4.97
1992 Tony Fernandez SDN 40 0 20 -4.94
1993 Chad Curtis CAL 76 5 24 -4.94
1997 Todd Zeile LAN 17 3 7 -4.93
1993 Harold Reynolds BAL 28 5 11 -4.91
1982 Tony Johnson TOR 17 1 13 -4.89
2000 Vladimir Guerrero MON 22 3 13 -4.87
1985 Mike Marshall LAN 14 1 10 -4.86
1986 Willie McGee SLN 37 3 16 -4.85
1993 Pat Kelly NYA 24 0 11 -4.83
1993 Omar Vizquel SEA 26 0 14 -4.83
2004 Milton Bradley LAN 29 3 14 -4.79
1981 Garry Templeton SLN 22 2 12 -4.71
1991 Brett Butler LAN 67 2 28 -4.70
1995 Sean Berry MON 10 0 8 -4.68
1993 Willie McGee SFN 21 2 9 -4.67
1998 Edgar Renteria FLO 60 1 21 -4.66
1998 Carl Everett HOU 26 1 12 -4.65
1998 Tom Goodwin TEX 53 1 19 -4.64
1994 Shawon Dunston CHN 11 1 8 -4.63
2001 Jason Kendall PIT 27 0 14 -4.63
2003 Brad Wilkerson MON 24 1 11 -4.63
1980 Steve Garvey LAN 18 1 11 -4.62
1980 Damaso Garcia TOR 27 1 13 -4.57
1982 Ruppert Jones SDN 35 2 15 -4.55
1989 Tim Wallach MON 13 3 7 -4.54
1996 Garret Anderson CAL 16 1 9 -4.52
2000 Peter Bergeron MON 24 0 13 -4.49
1986 Omar Moreno ATL 36 3 16 -4.49
1997 Sammy Sosa CHN 37 3 12 -4.48
2004 Jerry Hairston BAL 22 3 11 -4.48
1997 Melvin Nieves DET 9 1 7 -4.47
1997 Brady Anderson BAL 31 3 11 -4.44
2002 Cristian Guzman MIN 23 0 13 -4.44
1997 Darryl Hamilton SFN 26 2 10 -4.44
1982 Charlie Moore MIL 13 1 10 -4.42
1982 Rod Carew CAL 27 0 17 -4.41
1991 Benito Santiago SDN 19 1 10 -4.40
1998 Raul Mondesi LAN 28 2 10 -4.38
1984 Rafael Ramirez ATL 31 0 17 -4.38
2001 Chipper Jones ATL 18 0 10 -4.36
2000 Warren Morris PIT 18 2 12 -4.36
1995 Jacob Brumfield PIT 37 3 12 -4.35
1997 Curtis Goodwin CIN 36 2 13 -4.33
1998 Chuck Knoblauch NYA 43 3 12 -4.33
2000 Jose Offerman BOS 8 0 8 -4.29
1986 Chili Davis SFN 29 1 13 -4.29
1990 Ozzie Guillen CHA 30 1 17 -4.29
2005 Oscar Robles LAN 8 0 8 -4.26
1997 Mickey Morandini PHI 29 0 13 -4.26
1986 Scott Fletcher TEX 25 3 11 -4.25
1983 Carney Lansford OAK 11 0 8 -4.23
1990 Carney Lansford OAK 27 0 14 -4.22
1990 Mike Devereaux BAL 26 2 12 -4.22
1994 Charlie Hayes COL 11 2 6 -4.21
1982 George Vukovich PHI 11 1 9 -4.21
1980 Elliott Maddox NYN 10 0 9 -4.20
2005 Brady Clark MIL 23 0 13 -4.20
2003 Casey Blake CLE 16 0 9 -4.19
1993 Mark McLemore BAL 37 1 15 -4.19
2006 Bill Hall MIL 17 1 10 -4.19
1996 Jeff Cirillo MIL 13 0 9 -4.18
1983 Alfredo Griffin TOR 21 2 11 -4.18
1993 Mickey Tettleton DET 11 1 7 -4.13
1982 Joe Simpson SEA 22 0 14 -4.13
1983 Brett Butler ATL 67 5 23 -4.12
1996 John Cangelosi HOU 28 2 9 -4.12
1991 Ellis Burks BOS 18 1 11 -4.11
2000 Jay Payton NYN 17 1 12 -4.10
2001 Randy Winn TBA 23 1 11 -4.07
1984 Marvell Wynne PIT 44 1 19 -4.07
1997 Paul O'Neill NYA 17 1 7 -4.06
2002 Carlos Lee CHA 8 3 7 -4.06
1982 Todd Cruz SEA 12 0 10 -4.06
1989 Hubie Brooks MON 17 0 11 -4.03
2002 Rafael Furcal ATL 42 0 15 -4.02
1980 Rick Burleson BOS 26 2 13 -4.02
2005 Jeromy Burnitz CHN 12 3 7 -4.02
1992 Jose Offerman LAN 40 2 16 -4.02
1987 Scott Fletcher TEX 25 2 12 -4.01
1994 Spike Owen CAL 10 0 8 -4.00

The State of the Game

Great article on Maury Brown's Business of Baseball site on called 30 Voices on the State of the Game. A nice wide spectrum of folks both inside and outside the game with varying opinions makes it an interesting read. Thanks Maury.

Thursday, December 14, 2006

Watching Baseball in 1895

This from Unca at Micrographia. Google has recently has recently scanned most of the U.S. patents back into the 19th century. Up till now, it was almost impossible to search online for patents before 1976 (you had to know the patent number). There’s some wonderful items on baseball (make sure you also search on "base ball" and use the advanced search to limit to years, etc.), one of which is this "Base Ball Game Illustrating Apparatus" from 1895.


As with later devices such as that depicted in the movie Eight Men Out and one I saw on display at the Field Museum in Chicago several years ago, the device tracks the status of the game as relayed via telegraph. This device allows for the manual manipulation of the players from behind the apparatus.

Monday, December 11, 2006

Don't Rusch to Judgement

A few weeks back I wrote a column at Baseball Prospectus titled "The Information Revolution" where I did a little analysis on the data captured with MLB.com's Enhanced Gameday application. Towards the end of the piece I envisioned what detractors might say to the growing amount of information and how it would overwhelm without informing.

"...to me the answer to the problem of overload is in how the information is analyzed, and then how it is presented. Information for information's sake is not the goal. Information analyzed in such a way as to inform the decision-making process on the field and in the front office is the end game. Indeed, more is not always better. More does provide the opportunity for better analysis, though, by broadening the kinds of questions that can be asked, and also the kinds of answers that we'll find."

That process of using new kinds of information to ask better question and find things that were not possible before was illustrated in an excellent essay in The Hardball Times Baseball Annual 2007 titled "Which Way Did It Go? By Greg Rybarcyzk. Greg runs the excellent Hit Tracker web site and after providing some background on homeruns and how they travelled in 2006, he gets down to business in analyzing the information he tracks in the cases of Josh Beckett and Glendon Rusch. Since Rusch is a Cub I found it especially interesting.

For those who care to remember that season that was, Rusch had about as bad a year as one could have. Way back on March 18 my buddies and I were witness to Rusch being struck by a line drive off the bat of Joe Borchard in a game against the White Sox down in Tuscon. From there things got worse. As Rybarcyzk documents Rusch gave up 11 homeruns in 22.3 April innings and wound up the season giving up a remarkable 21 homeruns in 66.3 innings before a blood clot in his lung ended his season on September 12th. Final line: 86 hits and 33 walks in those 66.3 innings, an ERA of 7.46, and a Pitching Runs Above Average (PRAA) of a dismal -20.

Perhaps that March performance really did set the tone because on that day the wind was blowing 20 to 30 miles per hour straight out and Rusch gave up two homeruns in the outing. And according to Rybarcyzk 20 of the 21 homeruns hit off of Rusch enjoyed a tail wind increasing the distance an average of 27 feet. Further, all of them were hit at an altitude of 535 or greater. Both factors were highly unlikely. Taking the distance, altitude, and direction of all of Rusch's homers and placing them in the context of Shea Stadium (elevation 10 feet with an average wind speed of 10 mph blowing in from left field) he finds that only two of the 21 homeruns would have left the park and only one other ball would likely have been a double off the wall. Of course, more realistically he then removes the wind factor and calculates that 9 of the balls would have gone out with one additional double. Yes, Rusch pitched poorly in 2006 but was also the recipient of some awful luck that made it look worse than it was.

As a side note luck seems to effect Rusch more severely than other pitchers as I've noted in the past his large fluctuation in BABIP from .386 in 2003, to .298 in 2004 to .350 in 2005.

The ability to do this kind of analysis only grows with the availability of information. Obviously a team could use this kind of analysis to help make a decision on whether to give a guy like Rusch another shot or even project what a player might do in another ballpark (Rybarcyzk's analysis of Beckett is interesting in this regard). As the data set is expanded to include not only homeruns but all batted balls, a whole new set of adjustments can be created that not only remove the effects of wind and altitude but can also go a long ways towards factoring out luck in general. And as the layers of the onion are peeled back we'll get closer to the skills and attributes that can better inform the decision making process.

Friday, December 08, 2006

The Balance of Power

Fascinating article by David Gassko yesterday on THT related to lineup balance. I've often thought that, offense being slightly nonlinear, a balanced lineup would create more runs in a statistically significant fashion than one where most of the punch was concentrated in a few individuals. The 1998 Yankees and 2001 Mariners are the anecdotal evidence I had in the back of my mind. Gassko uses the case of this year's Tigers and after developing a method to quantify lineup balance, concludes that balance essentially makes no difference.

He looks at both run production and Pythagorean record and although both correlations were in the proper direction, they were statistically insignificant. This result, in part, verifies the findings of Cyril Morong in this study from 2002. It would be interesting to use David's approach for OBP only instead of weighted OBA (wOBA) to see if he could replicate the result.

More interestingly, however, he does a variant study in discussing the dependency on homeruns in the post season. Here he finds that...

It turns out, there is a strong (r = .153, p = .002) correlation between a team’s reliance on home runs and its success in the playoffs. If an average teams jumped to the 68th percentile in terms of its reliance on home runs, it would increase its postseason winning percentage by .037 points (or six wins per 162 games). That is a huge effect. It would most certainly behoove playoff contenders to build up their power.

The result follows logically since in the post season the run environment is smaller (teams have better pitchers), the impact of homeruns is magnified since there will be fewer runners on base. The 2005 White Sox are a case in point and this finding of course flies in the face of the common wisdom that teams that rely on "small ball" are more successful in the post season.

Winning the West

Nice recap by Tracy Ringolsby on how the NL West rosters have changed (or not changed with re-signings) as a result of the activity during or before the Winter Meetings. Clearly, the Dodgers are in the driver's seat at this point with the addition of two starting pitchers and re-signing Takashi Saito. Of course, they'll have to contend with lots of outs in the first inning (Grady Little said on MLB.com that Pierre would hit in the first inning batting either first or second) with the addition of Juan Pierre. Nomar Garciapara will continue to be an injury risk as well. The loss of Jason Schmidt and Moises Alou loom large in San Francisco but the addition of Greg Maddux should be an excellent one for the Padres.

Thursday, December 07, 2006

Winter Meetings - Day 4

If you haven't been paying attention to the winter meetings and the free agent market that has skyrocketed by as much as 70% according to Nate Silver at BP, here's a quick recap of the transactions (so far) from today.

  • Atlanta Braves - Acquired RHP Rafael Soriano from the Seattle Mariners in exchange for LHP Horacio Ramirez.

  • Chicago Cubs - Acquired RHP Kevin Hart from the Baltimore Orioles as the player to be named later in the December 6th trade of INF/OF Freddie Bynum.

  • Chicago White Sox - Acquired LHP Gio Gonzalez from the Philadelphia Phillies as the player to be named later in the Dec 6 trade of RHP Freddy Garcia.

  • Cincinnati Reds - Acquired OF Josh Hamilton (Rule 5 Draft selection) from the Chicago Cubs in exchange for cash considerations.

  • Detroit Tigers - Acquired LHP Edward Campusano (Rule 5 Draft selection) from the Milwaukee Brewers in exchange for cash considerations.

  • Kansas City Royals - Signed RHP Gil Meche to a five-year contract.

  • Oakland Athletics - Acquired OF Ryan Goleski (Rule 5 Draft selection) from the Tampa Bay Devil Rays in exchange for LHP Jay Marshall (Rule 5 Draft selection) and cash considerations.

  • Philadelphia Phillies - Acquired RHP Alfredo Simon (Rule 5 Draft selection) from the Baltimore Orioles in exchange for C Adam Donachie (Rule 5 Draft selection) and cash considerations.

  • Seattle Mariners - Acquired RHP Sean White (Rule 5 Draft selection) from the Pittsburgh Pirates in exchange for cash considerations.

  • Texas Rangers - Acquired C Salomon Manriquez (AAA Phase Rule 5 Draft selection) from the Colorado Rockies in exchange for cash considerations.


  • As you can tell, the Rule 5 draft was held today and there were some interesting names in the mix including Josh Hamilton going to the Reds and, for Rockies fans anyway, Jason Smith heading from the Cubs to the Blue Jays. Kevin Goldstein breaks it all down as does Baseball America.


    The signing of the day, however, was clearly the Royals hitching their wagon to Gil Meche. At 28, he's an interesting signing but any contract of more than about three years is probably based more on hope and faith than anything else and his major should surgery of 2001 has probably limited his upside and shortened his horizon. In addition, for the Royals to spend $10M on any single player that does not get them over the hump and into the post season is probably a mistake. In monetary terms he simply can't be worth that much to a small market team like the Royals. Moving from 85 to 95 wins is the sweet spot, not from 65 to 75 (although I'm certainly not saying Meche will improve the team by 10 games). Vince Gennaro has another interesting essay on this topic in the THT 2007 Annual where he shows that even a 95 win season would yield the Royals the second lowest amount in terms of local revenues (the Twins were last).

    MLB.com is reporting that the total outlay at the Winter Meetings thus far is $433M. Ouch. Maury Brown also has a nice list of the free agents, their ranking (A, B) and who they signed with along with the compensation the team gets who lost the free agent. Fortunately for the Royals Meche was a type B free agent and therefore won't cost them a draft pick.

    Making a List

    Is there anything better than opening a book about our national pastime in front of a warm fire at Christmas?

    With the Christmas holiday fast approaching (as constantly reminded by my daughters), today I'll do my best to help provide you with some ideas for that special someone in your life (who is a baseball fan of course) by running down my shortlist of favorite baseball books published in 2006.


    1. Baseball Prospectus 2007. Did you really think I wouldn't be a good organizational soldier? In all honesty, this being my first year of watching and participating in the process of putting this annual together has shown me the tremendous amount of thought, analysis, and research that go into the book. And although it won't ship until the new year, I'm sure your loved one will be more than satisfied with a promissory note in their stocking. But while they're waiting there's always a gift subscription. Aren't you impressed that I got them both in?


    2. The Echoing Green. This book by Joshua Prager takes the reader on a fascinating and amazingly in-depth exploration of the 1951 pennant race and its participants focusing on the intertwined destinies of Ralph Branca and Bobby Thomson. The book is suitable for any fan whose interest lies in the history of the game or indeed anyone with an interest in history as the book goes far beyond the events of the field and illuminates the cultural context within which the "Shot Heard Round the World" echoed. For those who want the full review, take a look at my column this week where I review it in depth.

      It is certainly the case that the book is written in a more literary and sometimes lyrical style than the sports writing most of us are accustomed to. And there are even a few $5 words to boot including "puissant", "lacuna", and "avoirdupois", for which you'll need to consult your dictionary. That said, the writing doesn’t get in the way of the story and often serves to move the flow of events along. It is really an excellent book and one that I doubt you or that special someone will regret investing in.


    3. The Book. Self published by the trio of Tom Tango, Andrew Dolphin, and Mitchel Lichtman,The Book is simply the most densely packed collection of sabermetric studies ever published. After laying out the methodology and tools in chapter one that include run expectancy, Markov chains and win expectancy, a new statistic called Weighted On Base Average (wOBA) which is essentially (OBP * 2 + SLG) /3, and the essence of random variation, the authors use the tools to discuss everything from the essence of clutch hitting to game theory and how it applies to strategic decision making in the game. And although the book is hard slogging at times with prose that is somewhat challenging and more tables than you can shake a stick at (140 in 380 pages), the authors compensate by summarizing core conclusions in callouts within the text that are prefaced by "The Book Says". Any fan interested in baseball strategy will appreciate it for that reason and for those more versed in performance analysis it is a must for the library.


    4. Baseball Between the Numbers. I wouldn't be honest if I didn't include BBTN in this list and so this time I'm not just being politically correct (and I had nothing to do with the production of the book having come on board after its publication). As with The Book, BBTN packs a plethora of sabermetric studies into its 374 pages, many of them either new (in contradiction to one of the reviews I've read) or done with a methodology not employed previously. However, this book is much more readable and geared to the fan interested in what the new breed of performance measures reveal about the game. Broken into nine chapters with three topics in each, the authors begin each topic with a question such as "Is Joe Torre a Hall of Fame Manager?" by James Click or "Are New Stadiums a Good Deal?" by Neil deMause and then use that as a platform to explore relevant surrounding issues. No doubt the thinking fan on your list will find it entertaining and educational.


    5. Rob Neyer's Big Book of Baseball Blunders. This was one of my favorite books of the year and one I reviewed on BP back in July. It combines the elements of good story telling and pertinent analysis that Neyer, as a student of the game, has become known for. I'll let the review speak for itself but suffice it to say that the book is a fascinating "what if" analysis of moves that were made and not made and for which a reasonable argument was available, although not always voiced, at the time.


    6. The Fielding Bible. I've made no secret of the fact that I'm a big fan of the methodology used and the understanding gained from the Plus/Minus system John Dewan and Baseball Info Solutions developed and published early in 2006. I've written as much on more than one occasion and although complete data for 2006 remains unpublished, the baseball fan on your list will still enjoy this one.


    7. The Hardball Times Baseball Annual 2007. The seemingly tireless Dave Studeman over at THT has done another remarkable job of pulling together a retrospective that is both chock full of analysis on the season that was and offers copious content related to the history of the game and sabermetric analysis. Its 352 pages are filled with essays by the full crew at THT plus a few guest appearances by the likes of Rob Neyer and Rich Lederer as well as John Dewan's fielding metrics at the team level. Having received my copy earlier this week, I can testify that any fan with an interest in the game will appreciate this year's edition – and learn more than 10 things.


    8. The Bill James Handbook 2007. As with the THT annual the handbook is published by ACTA and has become a yearly staple of my December reading. Although it contains precious little in terms of prose, this year's offering includes John Dewan's Plus/Minus fielding leaders for 2006, an enhanced baserunning section which I'll review in a few weeks, and a new essay and section on "Manufactured Runs" by Bill James. These are in addition to the team efficiency report introduced last year, standard batting, pitching, and fielding records, lefty/righty splits, the manager's record, park indices, leader boards, and hitter and pitcher projections. There's enough here for any interested baseball fan to chew on throughout the Christmas break and beyond.


    9. Winners. This effort by Dayn Perry published early in the year provides an excellent look at the profiles of teams that make it to the post season. Using an analytical approach, as you might imagine, leads Perry to some well-reasoned conclusions. I wrote a review of it earlier this year over at THT.


    Happy shopping!

    Friday, December 01, 2006

    The Royals Roundtable

    Garth Sears, author of Royal Ingenuity: Where Pine Tar and Powder Blue are Revered, was kind enough to invite me to share a few thoughts on the Royals in a new roundtable he started over at Baseball Think Factory. The topics range from Dayton Moore and free agency, to the futures of Jimmy Gobble and Mark Teahen. Some readers will notice that a few of my comments are now a bit dated with the recent signings of Jamie Walker, Randy Wolf, and the revelation of the $51.1M bid for Matsuzaka. Anyway, hope you enjoy.

    Also wanted to mention that my column this week takes a second look at the issue of first contacts wherein I reverse myself. Turns out I hadn't considered an excellent study by Dave Smith (you can find an older version online) - the presentation of which I saw at SABR 36 this summer in Seattle. When that's taken into consideration it appears hitters have the relative advantage the first time hitter and pitcher meet at the major league level (using 2000-2004 data). I also take a look at performance over the course of the first 15 confrontations between hitter and pitcher pairs.

    Tuesday, November 28, 2006

    Prognostications

    I missed this article by Tom Tippett of Diamond Mind on the results of preseason divisional rankings. Using their methodology borrowed from Pete Palmer I came out solidly in the middle with a score of 54. Congrats to Jonah Keri who placed 10th with a score of 44.

    Sunday, November 26, 2006

    Quick Takes Post Thanksgiving

    Two items of interest I ran into this evening while getting ready for the post-holiday week.

  • McGwire Reasoning - Interesting article in the Philadelphia Inquirer on some of the opinions of members of the Baseball Writers Association of America on the upcoming ballot for the Hall of Fame. Essentially I agree with those who want to take a wait and see attitude with the steroids era in general and McGwire in particular. There's no rush and history will give us a better perspective. Aside from that I'm also in agreement with those who think that perhaps Mark McGwire does not possess Hall of Fame credentials and is more comparable to a Roger Maris albeit with inflated numbers as a result of playing in an inflated era. It would also look very strange for him to be inducted alongside Tony Gwynn and Cal Ripken.


  • Defense, Defense - Nice article by Joe Hamrahi over at Baseball Digest Daily on defensive metrics complete with some comments by John Dewan on The Fielding Bible metrics which I like very much and which changed a bit this year. The Bill James Handbook 2007 has them in abbreviated form and Joe lists how those stack up against the Gold Glove voting with the largest error in the voters selecting Omar Vizquel over Adam Everett. It's unfortunate that there apparently won't be a fielding bible published this year and that the handbook contains scant information.
  • Saturday, November 25, 2006

    MVP Controversies

    So the MVPs are in and as usual we've got lots of controversy. For my part, I think the selection of Ryan Howard in the NL is at least a defensible one.

    Yes, Jim Baker did a nice job in breaking down the statistical argument and showing that while Howard and Pujols were matched offensively (85.4 to 81.5 in VORP, .346 to .337 in EqA in Pujols' favor), Pujols' defense puts him over the top in WARP 11.9 to 8.6. And yes, the voters picked the top three in reverse order of RBI which Dayn Perry rightly derides. But still, the selection of Howard is less controversial in my eyes since he did in fact lead a second half surge that got the Phillies on the cusp of the post season (Joe Sheehan also disagrees). Clearly he was an extremely valuable player as was Pujols. It's also good for baseball to have a new face capture the award and let's face it (warning: Cubs fan rant) Pujols shouldn't have gotten the award over Derrek Lee last year anyway so he was due for a snub :)

    But the selection of Justin Morneau is more problematic, not necessarily because of the outcome but because in that outcome the weakness of the process was on display for all to see. As some have argued, Morneau was perhaps the fourth most valuable player on the Twins when you consider the key defensive positions played by Torri Hunter and Joe Mauer. What's more interesting to see, however, is the actual votes that were cast in the AL race and how Joe Mauer was left off of five ballots altogether. One can argue whether or not Johann Santana should be considered but Mauer, at a tougher defensive position, I would have thought would split the vote thereby allowing Derek Jeter to sneak in. I've also heard discussed the possibility there might be an anti-New York bias but I can't see how that's the case given that Alex Rodriguez won the award last season.

    In the final analysis I do like that performance rankings aren't a mandated part of the MVP selection process and that there is room for the voters to consider a whole host of factors that quantitative analysis would miss. But leaving players of the quality of Mauer off the list and instead including A.J. Pierzynski as happened in once case simply boggles the mind. Clearly what needs to happen is to open the voting to a much wider audience in the hopes that the wisdom of crowds will make better reasoned choices. Fourteen people who essentially possess no special qualifications is just too small a group to not lay an occasional egg.

    Wednesday, November 22, 2006

    Rockwell Automation

    Here's a hilarious post and comments section. Cub fans will no doubt find something in it.

    Tuesday, November 21, 2006

    Chat Transcript 11/21

    Thanks to everyone who participated in the chat today. Feel free to add to the discussion here and I'll do my best to chime in.

    Monday, November 20, 2006

    The Physics of the Curveball

    I received this interesting article from my father-in-law related to the physics of baseball from the August 13, 1883 edition of The New York Times. It reads:

    THE CURVE BALL
    From the Lancaster Penn. New Era Aug 11

    Under the new method in base-ball many players have become adept at pitching what is styled the "curve" ball, delivering the ball toward the batter at what he regards the desired height but which, when nearing the home plate, through the power of a curve or twist given it by the pitcher, either drops or goes up or out from the plate, puzzling the batsman, and often preventing him from hitting the ball at all. Mr. Robert J. Houston made an offer of $10 to any person would accomplish a test experiment which he would give him. The challenge was accepted by Hofford, the Ironsides pitcher, and Mr. Houston, accompanied by a number of friends and Messrs. Hensel, of the Intelligencer, Pyott and Allen A. Gerr as judges repaired on Friday afternoon to the rear of the Lancaster cemetery to have the vexed question settled. The test prescribed was to pitch a ball on the opposite sides of three posts placed in a straight line, the one 25 feet from the first and the other 22 1/2 feet from the second; in other words, to pitch the ball on the left side of the first, the right side of the second, and left side of the third, describing a snake-like action and proving the existence of the curve. For a number of attempts Hofford failed to get the ball to curve from the second post to the proper side of the third, the ball frequently striking the second post. Finally he got it around to hit the third post, and with a few more efforts accomplished the task to the satisfaction of everybody present. Mr. Houston promptly handing over the reward.

    Of course the question of just who invented the curveball has been the subject of some debate with the two most prominent figures being Candy Cummings, who claimed he thought of the idea in 1863 as a boy watching thrown clam shells curve, and Fred Goldsmith who made the first public demonstration of the curve on August 16, 1870 some 13 years before this article and using the same experiment. While it seems interesting at first that the question was still an open one over a decade after it had been shown, keep in mind that the question was still being debated in the 1930s and 40s and it wasn't until 1959 that Lyman Briggs, using wind tunnel experiments, showed scientifically that the ball curves and how far.

    But what's interesting is that Briggs' experiments, and as discussed by Robert Adair in the book The Physics of Baseball, showed that a curve ball only deviates from the straight line drawn from the pitcher's release point to the point at which it crosses the plate by around 3.4 inches (when viewed from above) and all the while moves in a smooth arc. This is the reason that Hofford the pitcher had such difficulty in getting the ball to get around the second post. There simply isn't much margin for error in trying to throw a ball that is a shade under 2.9" in diameter. However, as seen from the pitcher's and batter's perspective the ball curves some 14 to 17 inches with half of the deflection coming in the last 15 feet or so. This is why Hofford, once he was able to traverse the second post, had an easier time with the third. Interestingly, as Adair says, "neither the smooth arc nor the break is an illusion but a different description of the same reality."

    Chat Tomorrow

    Just a reminder that there is a chat scheduled with yours truly on BP tomorrow at 11AM Mountain Time/1 PM Eastern. It works better for me if you can get your questions in early. See you then.

    Friday, November 17, 2006

    Numb3rs

    I assume some of you caught last Friday night's episode wherein a 25 year-old high school dropout and fantasy league champion sabermetrician detects steroid use. Well. I've tried to be a fan of the show but haven't been able and this episode was no exception. I did write about it and The Science Channel program "Baseball's Secret Formula" this week on BP so you can check that out.

    As far Numb3rs was concerned, did appreciate our hero the math professor noting that sabermetrics "really is a powerful form of analysis," and, in a voice-over companied by some nice graphics, he continued:

    The physical nature of the game involves chance. So the difference between a hit and out could be millimeters or milliseconds. So when you have athletic situations involving chance repeated over and over again, a statistical analysis can isolate and reveal human performance.

    Nice. Much of the rest wasn't however.

    Tuesday, November 14, 2006

    Yes, More Gyroball

    SABR member Alan Nathan who is a Professor of Physics at the University of Illinois has weighed in on the physics of the gyroball. According to many published reports like the CBS news story I linked to a while back, the pitch would have a sharp break away from right-handed hitters when thrown by a right-handed pitcher.

    Nathan, however, disagrees and using figures given to him by Dr. Ryutaro Himeno, the Japanese computer scientist who discovered the gyroball, shows that the pitch would much more likely behave like a split-fingered fastball since a "pure gyroball" would have no backspin and therefore no lift as does a regular fastball. It would, however, have a very small amount of break away from a right-handed hitter.

    However, Nathan also includes two additional models for gyroballs with slightly different spin axes and these wouldn't have as much downward break because of more backspin but the "gyroball with side force" would behave much like a cut fastball but with more drop. This may be why Al Leiter in the CBS piece said the pitch looked like a cut fastball.

    Monday, November 13, 2006

    Helton Fouls 'em Off

    Baseball fans love foul balls.

    I'll have to admit however that despite having attended a couple hundred major league games I've never myself caught one. The closest I ever came was a game at Turner Field, when sitting in the loge section just to the first base side of home plate in the first row, a foul ball flicked off my oustretched fingers as I leaned down towards the field. Oh, and I was also almost killed by an Andre Dawson line drive at Wrigley Field but that doesn't really count since I was attempting to catch that one and was instead cowering behind my seat down the third base line.

    In any case, I'll bet you're all wondering what players hit the most foul balls in 2006. Wonder no more. The top 20 are.


    Name Fouls Pitches PA F/PA F/P
    Todd Helton 563 2553 649 0.867 0.221
    Grady Sizemore 556 3014 751 0.740 0.184
    Alfonso Soriano 537 2840 728 0.738 0.189
    Michael Young 534 2802 748 0.714 0.191
    Chase Utley 528 2927 739 0.714 0.180
    Matt Holliday 517 2413 667 0.775 0.214
    Jeff Francoeur 513 2277 686 0.748 0.225
    Derek Jeter 503 2691 715 0.703 0.187
    Brian Roberts 497 2419 630 0.789 0.205
    Adrian Beltre 494 2572 681 0.725 0.192
    Carl Crawford 493 2314 653 0.755 0.213
    Carlos Guillen 476 2372 622 0.765 0.201
    Adrian Gonzalez 475 2460 631 0.753 0.193
    Magglio Ordonez 474 2286 646 0.734 0.207
    Chad Tracy 473 2649 662 0.715 0.179
    Johnny Damon 472 2743 671 0.703 0.172
    Hanley Ramirez 470 2798 700 0.671 0.168
    David Wright 468 2601 661 0.708 0.180
    Kevin Youkilis 463 3004 680 0.681 0.154
    Vladimir Guerrero 461 2101 665 0.693 0.219


    Personally, I'm not surprised that Todd Helton takes the top spot. Helton missed 14 games in late April and early May to what was diagnosed as "acute terminal ileitis". He then perhaps pushed himself too hard and played in 48 straight games upon his return never really regaining his form. In watching him in it certainly appeared as if his timing was a bit off thereby fouling off a tremendous number of pitches. Note that you see other free swingers in this list including Helton's teammate Matt Holliday, Alfonso Soriano, and uber-free-swinger Jeff Francouer.

    I'll bet you also didn't know that Ronny Cedeno fouled off 14 of the 27 pitches in 4 plate appearances against Fernando Nieve thereby taking the top spot in fouls per plate appearance.

    As far as pitchers are concerned here are the top 20 in fouls per plate appearance.


    Name Fouls Pitches PA F/PA F/P
    Jonathan Papelbon 258 1023 257 1.004 0.252
    Rafael Betancourt 227 899 231 0.983 0.253
    Russ Springer 223 1008 240 0.929 0.221
    David Aardsma 208 962 225 0.924 0.216
    Neal Cotts 230 1031 251 0.916 0.223
    Rafael Soriano 215 981 241 0.892 0.219
    Scott Baker 327 1441 377 0.867 0.227
    Bob Howry 271 1298 314 0.863 0.209
    Jose Valverde 188 924 223 0.843 0.203
    Jason Frasor 180 932 215 0.837 0.193
    Curt Schilling 696 3244 834 0.835 0.215
    Mariano Rivera 244 1101 293 0.833 0.222
    Chris Young 610 3025 735 0.830 0.202
    Scott Proctor 353 1594 426 0.829 0.221
    John Maine 300 1511 365 0.822 0.199
    Jonathan Broxton 262 1305 320 0.819 0.201
    J.J. Putz 248 1215 303 0.818 0.204
    Jeremy Accardo 243 1217 297 0.818 0.200
    Billy Wagner 242 1242 297 0.815 0.195
    Alan Embree 180 823 221 0.814 0.219


    Not sure what this means if anything other than perhaps pitchers with hard breaking stuff induce more fouls.

    Scouting with SABR

    Last Saturday night was the annual banquet of the Rocky Mountain SABR chapter and my wife and I were in attendance with approximately 75 other baseball fans. Last year was the first I had attended and like last year the event was a great deal of fun and the speakers entertaining.

    Like last year the dinner was held at the Denver Athletic Club in downtown Denver and right down the hall from a large crowd at the Denver Sailing Association.

    The evening got underway as Paul Parker, treasurer and Rockies club historian and manager of the "community fields" program, introduced Keith Bleyer who served as the MC for the evening. Keith servers as the roving reporter on Fox Sports Rocky Mountain telecasts of Rockies games. After reports from Parker and Neal Williams the chapter president while we enjoyed our dinners, Bleyer introduced the first speaker, Matt Vinnola, who manages the professional scouting organization for the Rockies.

    Matt spoke for about 20 minutes and in that time took the crowd through a typical season in the professional scouting department starting with the end of the season and running through the crescendo of his work - the July 31st trading deadline of the next season. Matt manages 10 people including several former managers such as Marcel Lachemann and other scouts whose job it is both to scout all of the other team's existing players as well as the Rockies organization. Although he lost some of the crowd in his explanatin of article 19 versus article 20 free agents and other rules of availability, he provided a great deal of information in a short period of time. Essentially Matt's job is to consolidate information from his scouts as well as supplementing that data with the MLB's scouting bureau in order to do things like maintain the 40-man roster boards on all 30 teams, create a top 20 prospects report on all the teams, and provide input on which teams are likely to re-sign players and go after particular free agents. All of this information is then fed to the decision makers in GM Dan O'Dowd and Assistant GM Bill Geivett.

    Over the course of last season Matt estimated he read upwards of 9,000 reports on various players and while he admits he's not a scout, he's conversant enough in the language and has read enough reports to be able to pour through them and filter the necessary information. Actually, he said if he were a scout he'd be a "3-5-7" scout meaning that on the 8-point scouting scale he can look at a player and see if he's not very good, a decent player, or really good. The subtleties of arm angles and motion repeatability are more difficult and feed into the finer distinctions drawn by professional scouts. He also noted that's not a stranger to doing a bit of statistical analysis himself and shared an interesting factoid - the Rockies in 2006 were second in all of baseball behind only the Yankees in run scoring in innings 1 through 6 but dead last from the 7th inning on. He didn't speculate as to why this might be the case however. And he also mentioned that while of course the information from his scouts is treasured, he also scours the internet looking at STATS and other sites to provide as complete a picture as possible.

    At the end of his talk he fielded a few questions and when asked about performance enhancing drugs, he was quick to point out that while he thinks evaluating players (pitchers too) with potential PED issues is among the biggest challenges, the data he's looked at hasn't shown the drastic decline that he would have expected. He answered several other questions including one the likelihood of scouts in the hall of fame (he's all for it not surprisingly) and in all his talk was enthusiastically given and very well received.

    After Bleyer entertainingly played auctioneer in the auctioning off of an autographed Rockies bat ($180) and "A League of Their Own" movie poster ($425) autographed by Tom Hanks and Madonna among others Thomas Harding of MLB.com and the "feeling good feeling clean" report on MLB radio gave the keynote address. Harding talked about his career from his humble beginnings in Bluefield West Virginia to his days in Memphis and finally his opening with the Colorado Springs Gazette that has since led him to Denver. He told several interesting anecdotes but probably the most entertaining was his first experience in covering a major league game in Atlanta in 1983 while still a college student. Failing to ask manager Joe Torre his question at the right time, he hung around afterwards and summoned the courage. Torre immediately asked him when he graduated and proceeded to allow the young reporter to ask his questions while he shaved. From there Harding was hooked.

    The evening ended with the closing of bids on various items including baseball books and cards. Yours truly snagged a copy of Saving the Pitcher by Will Carroll and I'll admit to having outbid the keynote speaker. President Williams also awarded SABR memberships to Bleyer and the two speakers. Once again a very entertaining evening in the fellowship of other baseball fans (sponsored I might add by the Rockies organization). What's not to like?

    Wednesday, November 08, 2006

    Quick Takes

    In the middle of a week it's always a good time to put in a few quick takes.

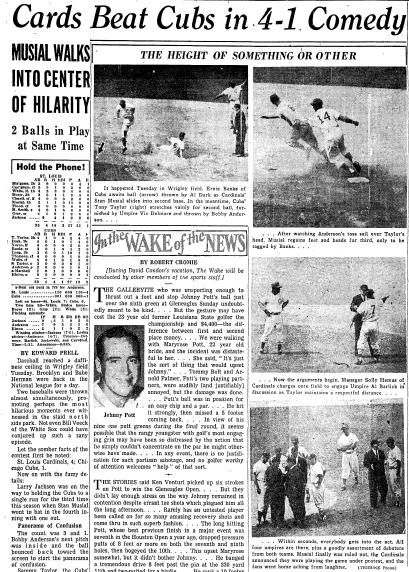
  • First, there was this I received from my father-in-law. It's a story on the front of the sports page of the Chicago Tribune for Wednesday, July 1st 1959. The previous day was the infamous "2 balls in play" game between the Cubs and Cardinals.


    As related in the aricle, with Stan Musial up with one out in the fourth and the count 3-1 the pitch from Bobby Anderson got away from the catcher Sammy Taylor and bounced back towards the screen. Taylor, instead of retrieving the ball, started arguing with home plate umpire Vic Delmore over whether the pitch was actually fouled. Musial of course had trotted to first and when he noticed that neither Anderson nor Taylor was seemed interested in the ball, he took off for second. In the meantime Alvin Dark, playing third, raced for the ball which was picked up by the bat boy. Dark intercepted the ball however as the bat boy was tossing it to the field announcer. About this same time Anderson was given a new ball by Delmore and when he saw Musial almost at second, he threw to to second as did Dark. Luckily for the Cubs Anderson's throw sailed well over the bag and Musial, seeing this rounded the bag while Dark's throw was a one hopper that Ernie Banks, covering from short, caught and used to apply the tag to Musial for the out. The Cardinals of course argued and ultimately played the game under protest. The Retrosheet game log desscribed it thusly:

    CARDINALS 4TH: Cimoli grounded out (shortstop to first); Musial walked; The fourth ball to Musial rolled to the stands. Dark chased it down and threw to secondbase to Banks who tagged Musial.Meanwhile umpire Delmore at the plate handed a new ball to Sammy Taylor who threw it into CF as Musial continued to third. After a long argument the umps decided the original ball was in play and that Musial was out. The Cardinals then played the game under protest; H. Smith singled to shortstop; Gray struck out; 0 R, 1 H, 0 E, 1 LOB. Cardinals 2, Cubs 1.


  • What I found even more interesting however was a second article on the front page titled "That Was a No Hitter Sobs Jones" that describes the one-hitter he threw the night before against the Giants in a 2-0 Dodgers win.


    What was most interesting was this excerpt:

    "Puffing compulsuively on a cigarette and with tears streaming down his face, he brushed aside the hand of the official scorer Charlie Park of the Los Angeles Mirror-News, when the baseball writer tried to explain why he called Jim Gilliam's roller to short in the eighth a hit."

    "'I don't think it was a hit whatever you may have called it,' sobbed Jones as he literally pushed aside Park....Park said he called the ball, which went to shortstop Andre Rogers, a hit because he thought the fleet Gilliam would have beaten it out even on a perfect play. Park said: 'I'm sorry Sam, but if I had to call it again I'd have called it a hit'"

    As I mentioned in a column a few weeks back on scorers, the practice of having reporters act as scorers was stopped in 1980 and in this case it seems pretty clear that Park, in trying also to write a story about the game, has a bit of a conflict on his hands if he wants to maintain a good relationship with the players. One wonders whether Park is saying that on second thought in his judgement it really was a hit or if under the circumstances he would call it an error to preserve the no-hitter.

    This story raises the question of just when it was determined that scoring decisions could be changed up to 24 hours after the game. In this case it looks as if the decision was final.

    This also gives us the opportunity to mention a recent study published in the Journal of Quantitative Analysis in Sports called Baseball Errors by David Kalist and Stephen Spurr. This paper was also briefly reviewed by Phil Birnbaum on his sabermetric research blog. Although they also investigate the issue of scorer bias, the authors find not surprisingly, that the error rate per game has steadily decreased over time likely owing to better equipment and better field conditions (they also considered rule changes in 1955 and 1967 related to slow handling and mental mistakes but didn't consider them relevant) and also that the error rate is statistically significantly higher in the National League than the American League. This they assumed could be attributed to speedier players in the NL historically that force fielders to rush their throws etc. resulting in more errors. That didn't turn out to be the case when they used stolen bases per game as a proxy for steals and so instead chalk it up to "lower standards" by official scorers in the AL, a conclusion that to me anyway seems implausible. Of course, off the top of the my head I can't think of a better reason and would have at first thought that the DH in the AL meant that the NL had fewer quality fielders as older players (Barry Bonds, Mike Piazza) are forced into the field. However, their study of rates both before and after the introduction of the DH indicates that this is not the case.

    When they then analyzed the data for bias they also found that error rates are significantly (statistically) higher in March and April and then settle down and that an opposing team's speed is also significant although again it doesn't explain the differences between the leagues. Finally, they did in fact find some evidence for home team bias but that the effect has declined since 1976 and attribute this to the removal of reporters from the position of official scorer and the advent of arbitration and free agency which has increased the stakes for the players.

    Now it seems to me that this analysis, as the authors admit, doesn't really tell us much in regards to scorer bias since if there is bias it would typically result in fewer errors called on the visiting team (since the scorer would be more likely to award hits to the home team and the opposing forces of not attributing errors to home team fielders and not wishing to charge a home team pitcher with earned runs would to some extent cancel each other out). Unfortunately, it's probably also the case that players field better at home and so it would be difficult with this methodology to determine which factor has more potency.

    For my money a more fruitful approach is to look at individual scorers assuming you have enough data since it's likely that if there is bias it will be much easier to spot in individuals than in the entire group. The data I showed in my column is a first attempt this.
  • Monday, November 06, 2006

    Rain, Rain, Go Away

    Last week my column on Baseball Prospectus included discussions of both postponements from an historical perspective spurred by the rainouts during this most recent post season coupled with one solution: bring back the regularly scheduled doubleheader.

    The data for postponements was provided by fellow SABR member Paul Rivard who kindly shared the information he has collected and gave me permission to publish it. As I shared in the column:

    "To summarize, Paul has access to both original and as-played schedules in a spreadsheet. He then uses the online service ProQuest to sift through the New York Times baseball section for each of the 170 or so days of the season and identify which games were actually postponed. Easier said than done, I'm sure. By indicating the postponements in his Excel files he can then run basic queries to calculate the percentage of games that were postponed. As a SABR member Paul has, for the time being, access to ProQuest through his membership. Unfortunately, that organizational access expires at the end of the year, so he's busily working his way through as many seasons as possible.

    As Paul mentioned to me in an e-mail, this data is preliminary, and there are bound to be small revisions in the numbers once he has more time to comb through the data in detail. For example, complete results will also include make-up games that were once again postponed. Of course, these shouldn't significantly change the numbers, but keep in mind that this is a bit of a work in progress. In addition, this data will also be combined with that from other SABR members and should eventually be made available on Retrosheet as part of the Game Schedules effort."

    Since the publication of the article which included data from 78 seasons including 1926-1955 and then sporadic years up to 2004, Paul has sent data for both 1925 and 1956. He's also done some more digging into 1949 and found that although there were 1232 games originally scheduled, there were a total of 1316 games played or intended to be played during that season. For that season 76 were postponed which results in a postponement rate of 5.78% (76/1316). The preliminary figure, which is what I shared in the column and will show in the graph below, results in a figure of 5.76% (71/1232). So the difference from a rate perspective is likely not significant meaning that the numbers you see in the graph below are illustrative of the overall trends.

    For kicks, here is how 1949 worked out (from an email from Paul):

  • There were 1232 originally scheduled games, all of which were eventually played (all teams played a full 154 games).

  • There were 8 games which ended as a tie which had to be replayed.

  • There were 71 postponements of originally scheduled games which had to be replayed.

  • There was 1 instance of a make up game set for play on an open date being postponed.

  • There were 4 instances of a make up game being set for play as part of a doubleheader being postponed.


  • Putting that together equals 1316 games (1232+8+71+1+4) which were played or were intended to be played. The total postponements were 76 (71+1+4).

    As for the overall trend the graph below shows the data points Paul has provided along with a best fit exponential trendline.


    As you can see, in the 1920s postponements were around 10-13% and that number has steadily declined to around 2% for 2004. There are a number of reason why this is the case and SABR members had some discussion of the topic when Paul originally shared this data several weeks ago. The most popular, though, included better grounds keeping (fields that drain better), the introduction of lights (allowing scheduled day games to be played, especially after 1950), geography (a greater percentage of the game being played on the west coast where it rains less), and stadium construction (domed and retractable roof stadiums along with artificial turf). All of these I go into in a little more detail in the column but of course the happy result is that 98% of the time you pack your family in the car, pay for parking, and shell out oodles of money for hot dogs and Dippin' Dots, you'll see baseball played.

    Paul also shared that indeed the ultimate goal is for this data to find its way into the Retrosheet game logs to provide a full record of how each major league season unfolded. And what more could any baseball fan really want?

    Thursday, October 26, 2006

    Should Randolph Have Bunted?

    I had the opportunity to talk with Carl Bialik, aka "The Numbers Guy" at the Wall Street Journal regarding Run Expectancy and Win Expectancy in reference to the Willie Randolph non bunting decision with runners on first and second and nobody out in the bottom of the ninth inning down 3-1 in Game 7 of the NLCS. Of course instead of bunting pinch-hitter Cliff Floyd struck out, Jose Reyes lined out to center, Paul LoDuca walked, and Carlos Beltran struck out looking to send the Cardinals to the World Series.

    Basically Carl is a Mets fan and wanted to explore how sabermetricians might evaluate the situation. The article is excellent but I just wanted to expand on my comments that he quotes.

    The core question is whether the Mets would have had a better chance of winning had he sacrificed. As a first approximation at an answer based only on numbers we can review the matrix that Tango/Lichtman/Dolphin provided in The Book. There they show a mathematically derived version of a run outcome matrix (as opposed to one derived from actual outcomes, which evens out the probabilities you'd see for some of the situations since some of them have few actual occurrences).

    In any case the matrix is calculated for a run environment of 5.0 runs per game, roughly equivalent to the game of 1994-2005. Using that matrix you see following:


    Base Out RE 0 1 2 3 4 5+
    12 0 1.585 35.3% 22.0% 16.2% 13.1% 7.0% 6.3%
    23 1 1.451 30.2% 28.5% 22.4% 9.9% 5.3% 3.7%


    So with runners on first and second and nobody out teams would be expected to score 2 runs exactly 16.2% of the time and 2 or more runs exactly 42.3% of the time. If they had sacrificed successfully, giving up the out for the bases, the team would (with second and third and 1 out) have a 22.4% chance of scoring 2 runs and a 41.3% chance of scoring 2 or more. In other words, given those percentages you would bunt if you were playing for the tie and swing away to play for the win. As Carl noted, the case for bunting is a little stronger than I had imagined. My assumption was that the probability of scoring 2 runs once you've bunted would be closer to that with first and second and one out indicating that the bunt would not be preferred.

    I've graphed this table so you can see how the lines cross with the probability of scoring various numbers of runs.


    But of course even if you were playing for a tie you'd have to execute the sacrifice first and overall that's about a 75% proposition (including those times when the defense doesn't get any outs which accounts for about 15% of the successful attempts).

    But...

    In this case the Mets were down by two runs in the bottom of the ninth
    and so rather than use Run Expectancy one can instead use Win Expectancy (WX) which Carl also talks about. He quotes BP's own Keith Woolner who created a mathematical model for WX. So using the same run environment of 5.0 runs per game (I'm using WX values generated by Dave Studeman using Woolner's work), the Mets would have been expected to win 21.6% of the time with runners on first and second, nobody out and 2 runs down. With a successful sacrifice their odds of winning go up to 29.4%. That makes the break-even percentage for the sacrifice at only 53.6% since if they fail their odds drop to 12.6% (assuming the failed sac leaves the runners on first and second with 1 out).

    So like I said, it's a closer call than I had suspected. But had Randolph elected to bunt who would have done it? Clearly the Mets would have called on Chris Woodward or Anderson Hernandez to lay one down but I think Randolph (like most people including me) would rather put the game in the hands of a proven hitter in Floyd. Also you have to consider that Adam Wainwright throwing 95 with that big curve is difficult to bunt on as well and the fact that the Cardinals would have been all over that bunt attempt which drives down the success percentage, actually making it more attractive for the pinch hitter to then swing away - game theory in action. In all I think Randolph made the right choice and it's hard to argue against his logic.

    Thing brings to mind other famous strategic decisions from post seasons past...

    The most recent one that comes to mind is Dave Robert's steal of second
    in game 4 of the 2004 ALCS. There the Sox were trailing 4-3 when Roberts pinch ran for Millar with nobody out. In that situation with a run environment of 3.6 runs (roughly equivalent to the deadball era thereby accounting for the fact that Mariano Rivera was in the game) the WX for the Sox stood at 31.1%. If Roberts steals successfully, then the WX goes up to 41.9% but if he fails it goes down to 9.1%

    The break-even percentage (the needed success rate of the stolen base
    to make it a break even play) can then be calculated as:

    BE = (.311 - .091) / (.419 - .091)

    Or .670, 67%

    In other words, if Roberts felt that he had at least a two-thirds shot at making it, then it was a good gamble. Apparently he did (we'll pretend anyway) and the rest is history.

    The other one that most folks will think of is Babe Ruth getting caught stealing to end the 1926 World Series against the Cardinals. In that situation Ruth walked with two outs in the bottom of the ninth and his team down 3-2. In that situation they had (using the Yanks 1926 run environment) a 9.5% chance of winning. Ruth of course was caught stealing but if he had been successful their odds would have gone up to 14.6%. As a result Ruth's break even percentage was 65.4%. Ruth's career stolen base percentage was around 50%. Ruth was of course thrown out easily with slugger Bob Meusel at the plate and so in that situation his odds may have been much smaller than 65% making it a poor play.

    Information Revolution

    My column this week on BP discusses aspects of the information revolution in the availabiltiy of data about the game. The most recent addition to that is the pitch velocities, break, and release point data used by the enhanced version of MLB.com's Gameday application. Taking a cue from a friend I wrote a little .NET Framework application to do basic pitch charting showing location, release velocity, and pitch outcome, and ran the app against Kenny Roger's Game 2 performance. For those interested, this is what the basic XML data looks like and those who've read Baseball Hacks will of course find this familiar.

    Monday, October 23, 2006

    Gyroball on CBS

    Just was forwarded this link from Will Carroll. Very interesting stuff - Al Leiter is apparently not impressed.

    Lyons Speaks

    BP's Maury Brown has a nice article this morning on the firing of Steve Lyons taken from a conversation that Lyons and Brown had in the last few days. For those without a subscriber account on BP you can view the transcript on Maury's The Biz of Baseball Web site and hear the interview on BP Radio from last Saturday.

    I've made my position pretty clear and there's nothing in the interview or the media in the intervening days that have changed my mind. The firing was either an excuse to get rid of Lyons or a case of political correctness run amok.

    Friday, October 20, 2006

    Internet Baseball Awards

    A little late I know but I finally got my ballet in the other day for the Internet Baseball Awards. Here's my ballot. Let the critcism begin.

    AL MVP
    1. Derek Jeter
    2. Travis Hafner
    3. Jermaine Dye
    4. David Ortiz
    5. Joe Mauer
    6. Carlos Guillen
    7. Johann Santana
    8. Justin Morneau
    9. Grady Sizemore
    10. Jim Thome

    AL Cy Young
    1. Johann Santana
    2. Roy Halladay
    3. Chien-ming Wang
    4. Barry Zito
    5. Justin Verlander

    AL Rookie of the Year
    1. Francisco Liriano
    2. Justin Verlander
    3. Kenji Johjima
    4. Jered Weaver
    5. Jonathan Papelbon

    AL Manager of the Year
    1. Jim Leyland
    2. Ron Gardenhire
    3. Ken Macha

    NL MVP
    1. Ryan Howard
    2. Albert Pujols
    3. Miguel Cabrera
    4. Lance Berkman
    5. Carlos Beltran
    6. Chase Utley
    7. Jose Reyes
    8. David Wright
    9. Alfonso Soriano
    10. Garrett Atkins

    NL Cy Young
    1. Roy Oswalt
    2. Chris Carpenter
    3. Trevor Hoffman
    4. Brandon Webb
    5. Carlos Zambrano

    NL Rookie of the Year
    1. Hanley Ramirez
    2. Dan Uggla
    3. Ryan Zimmerman
    4. Josh Johnson
    5. Prince Fielder

    NL Manager of the Year
    1. Joe Girardi
    2. Tony LaRussa
    3. Grady Little

    Quick Takes and Clogging

    A couple quick hitters on a Friday morning:

  • Found this interesting article on the Rockies Jeff Francis from earlier this season. I liked this quote from Francis when explaining the "hop" on a good fastball.

    "My second-year mechanics professor found out I was a ball player, and asked me to do a presentation with another softball player in the class," Francis recalls. "We read The Physics of Baseball, and one chapter was about the ball's flight toward the plate. The ball rising [is] an optical illusion. Normally, the ball drops a certain amount in the quarter-second or so that it's in the air on its regular flight towards home plate. If the right backspin is obtained, the air can hold it up just a bit longer on the way to home plate, dropping a certain fraction of the regular distance. Since the eye is so used to seeing it drop the regular amount, the ball gives the illusion of rising on the way towards the batter."


    This was interesting since I noticed that Tim McCarver said on the Game 1 broadcast that the four seam fastball rises. He didn't qualify the statement although I suppose its possible that he knows it doesn't actually rise but still, alot of folks don't.


  • For the next day or two ESPN.com is running a special where you can view the Inside Edge information. For example, here is the breakdown for Aaron Cook. It's interesting since it gives you a feel for how a pitcher works left-handed versus right-handed hitters and how the pitch selection differs. In Cook's case he uses his slider twice as much against right-handed hitters than against lefties where he instead relies on his changeup. Of course in his case he's throwing his sinker 82% of the time against both and trying to stay on the outside corner down.


  • My column on Baseball Prospectus this week used the now infamous Dusty Baker quote as as the introduction into investigating "base clogging" as discussed in a previous post. The results confirm Tom Tango's quick discussion on his blog that a good baserunner is probably only are held up by lead runners to the tune of 1 base per season.

    The following table shows some of the results that I didn't include in the column for space reasons. Essentially what it shows is how often runners advance in each of three categories of plays broken down by whether or not there was a lead runner on in front of the runner of interest. I calculated the values for each season since 2000 to see if there were any trends but as you can see overall the data are remarkably consistent.

    As you can see runners do indeed advance to third more frequently when on first when the batter singles and there is no runner on second but only by a small amount. Same goes for a runner on second when a batter singles as they score more often but again only be a few percentage points. The interesting thing is that when a runner is on first and the batter doubles, having a lead runner on seems to increase the liklihood that the runner will score. There are probably one or more other factors to consider but I don't have any real favorites at this point. I also did some checking with fast and slow runners and as expected the gaps widen but not by as much as one might think.


  • Batter Doubles with a Runner on First
    Lead? Opp To2nd To3rd Scores OA To2nd To3rd Scores OA
    2000 TRUE 934 479 424 31 51.3% 45.4% 3.3%
    2000 FALSE 1986 1079 845 62 54.3% 42.5% 3.1%
    -------------------------------------------------------------------------------------
    2001 TRUE 853 421 400 32 49.4% 46.9% 3.8%
    2001 FALSE 1866 1012 805 52 54.2% 43.1% 2.8%
    -------------------------------------------------------------------------------------
    2002 TRUE 827 461 341 25 55.7% 41.2% 3.0%
    2002 FALSE 1745 985 699 61 56.4% 40.1% 3.5%
    -------------------------------------------------------------------------------------
    2003 TRUE 817 414 386 17 50.7% 47.2% 2.1%
    2003 FALSE 1923 1033 823 69 53.7% 42.8% 3.6%
    -------------------------------------------------------------------------------------
    2004 TRUE 902 478 401 23 53.0% 44.5% 2.5%
    2004 FALSE 1932 1057 819 57 54.7% 42.4% 3.0%
    -------------------------------------------------------------------------------------
    2005 TRUE 852 445 379 28 52.2% 44.5% 3.3%
    2005 FALSE 1937 1071 804 62 55.3% 41.5% 3.2%
    -------------------------------------------------------------------------------------

    TOTAL TRUE 5185 2698 2331 156 52.0% 45.0% 3.0%
    FALSE 11389 6237 4795 363 54.8% 42.1% 3.2%


    Batter Singles with a Runner on First
    2000 TRUE 2924 1950 859 39 78 66.7% 29.4% 1.3% 2.7%
    2000 FALSE 6937 4779 2041 59 59 68.9% 29.4% 0.9% 0.9%
    -------------------------------------------------------------------------------------
    2001 TRUE 2601 1771 732 36 60 68.1% 28.1% 1.4% 2.3%
    2001 FALSE 6463 4505 1830 56 71 69.7% 28.3% 0.9% 1.1%
    -------------------------------------------------------------------------------------
    2002 TRUE 2749 1876 772 33 68 68.2% 28.1% 1.2% 2.5%
    2002 FALSE 6502 4521 1849 58 75 69.5% 28.4% 0.9% 1.2%
    -------------------------------------------------------------------------------------
    2003 TRUE 2771 1951 712 42 66 70.4% 25.7% 1.5% 2.4%
    2003 FALSE 6719 4752 1861 43 64 70.7% 27.7% 0.6% 1.0%
    -------------------------------------------------------------------------------------
    2004 TRUE 2753 1889 758 43 63 68.6% 27.5% 1.6% 2.3%
    2004 FALSE 6745 4777 1839 58 70 70.8% 27.3% 0.9% 1.0%
    -------------------------------------------------------------------------------------
    2005 TRUE 2719 1949 673 39 58 71.7% 24.8% 1.4% 2.1%
    2005 FALSE 6794 4828 1859 49 58 71.1% 27.4% 0.7% 0.9%
    -------------------------------------------------------------------------------------

    TOTAL TRUE 16517 11386 4506 232 393 68.9% 27.3% 1.4% 2.4%
    FALSE 40160 28162 11279 323 397 70.1% 28.1% 0.8% 1.0%


    Batter Singles Second with a Runner on Second
    2000 TRUE 1366 494 813 36 36.2% 59.5% 2.6%
    2000 FALSE 4445 1461 2792 145 32.9% 62.8% 3.3%
    -------------------------------------------------------------------------------------
    2001 TRUE 1249 457 739 40 36.6% 59.2% 3.2%
    2001 FALSE 4240 1442 2587 156 34.0% 61.0% 3.7%
    -------------------------------------------------------------------------------------
    2002 TRUE 1259 491 709 40 39.0% 56.3% 3.2%
    2002 FALSE 4335 1475 2655 150 34.0% 61.2% 3.5%
    -------------------------------------------------------------------------------------
    2003 TRUE 1268 460 747 44 36.3% 58.9% 3.5%
    2003 FALSE 4337 1499 2627 155 34.6% 60.6% 3.6%
    -------------------------------------------------------------------------------------
    2004 TRUE 1292 546 694 39 42.3% 53.7% 3.0%
    2004 FALSE 4240 1469 2590 144 34.6% 61.1% 3.4%
    -------------------------------------------------------------------------------------
    2005 TRUE 1243 487 703 38 39.2% 56.6% 3.1%
    2005 FALSE 4335 1578 2557 145 36.4% 59.0% 3.3%
    -------------------------------------------------------------------------------------

    TOTAL TRUE 7677 2935 4405 237 38.2% 57.4% 3.1%
    FALSE 25932 8924 15808 895 34.4% 61.0% 3.5%

    Tuesday, October 17, 2006

    Lyons Gone

    Not long after my previous post about Steve Lyons and Moneyball Mr. Lyons was dismissed by Fox for "racially insensitive comments" following an exchange that he and Lou Pinella had in the booth. Having not seen the actual broadcast it's kind of difficult to make a judgement but from the transcripts that have been reported, one suspects that the entire incident was a bit overblown.

    It seems as if Lyons was simply trying to be funny in tying Pinella's use of Spanish to his comment about Macro Scutaro's hitting being like finding "a wallet on Friday" and expecting to do the same again on Monday (which I thought was a great line). He probably had no idea that his comments came off sounding like they did (Spanish guys will steal your wallet or simply that Lou Pinella will steal your wallet, it's kind of hard to tell) or that they would be interpreted that way (by who I'm not sure) - the point being that the remarks were not thought out nor were they intended to offend.

    If Fox wants to fire him for not being a good analyst that's one thing (and there are many that might agree with that sentiment) but it smacks of caving to the most hyper-sensitive among us to immediately drop the axe for unscripted bantering that unfortunately took a bad turn.

    Thursday, October 12, 2006

    Buck O'Neil


    Not that I have anything much to add, especially after this wonderful piece by Bill James published on SABR-L, but I thought this piece by Alex Belth on the passing of Buck O'Neil was very appropriate. Having lived in Kansas City I can testify to the universal high regard with which he was held by everyone in the community. I met him on several occasions, the first time at a baseball card show in Overland Park where upon seeing my Cubs hat struck up a conversation about how he had coached for the Cubs and how he enjoyed the organization. Before we moved from Kansas City I took my daughters down to the Negro League Baseball Hall of Fame one Sunday when it was reported that Buck would be on hand so they could have the pleasure and memory of meeting him as well. There was a mixup and so he wasn't there but of course we again enjoyed the museum, which is a testimony to his efforts.

    Like most others I was first introduced to Buck through Ken Burns' documentary, and I think what drew people to him was the fact his love for baseball and life despite his early circumstances was so genuine and so transparent. He wasn't bitter and as a result he educated more people about the great Negro League players and the league than anyone else. It's a shame that even if his playing and managing impact wasn't deeemd worthy of inclusion in the Hall of Fame, they couldn't find a way of inducting him for his total contribution to the game.

    Tuesday, October 10, 2006

    Lyons on Moneyball, Sort Of

    I'm sure many of you caught this little conversation during tonight's ALCS Game 1 broadcast on Fox during the top of the 5th inning.

    Steve Lyons: "They [the A's] just do an outstanding job in their scouting department with Billy Beane and being able to spend the money that they have here - spend it well. They don't have alot of it but they know how to spend it."

    Lou Pinella: "So you like Moneyball then?"

    Steve Lyons: "I like some of the philosophies of Moneyball. I say give me a baseball player, give me a guy who plays baseball. Just like Billy Beane said, I was a great athlete, I wasn't a good player."

    Then the inning ended. Although time didn't allow any real explication of exactly what Lyons likes and doesn't like, I like the fact that Lyons is implying that scouting based only on tools is shortsighted just as scouting based only on undervalued skills or one dimensional skills also has its problems. The tone of the question from Pinella however, seemed just a little confrontational and Lyons responded well since it didn't appear he knew it was coming.

    The Case of the Politically Correct Pinkie

    So my wife was with our youngest daugther at her violin lesson the other day. While there the teacher in discussing the proper technique for holding the bow mentions that she is reluctant to refer to the smallest finger (pinkie finger) as "pinkie" because "several of my students have little fingers that are not pink."

    Now, the teacher is a wonderful lady and I mean no disrespect but does anyone else find that a little odd? Are we really so sensitive that the mention of the word "pinkie" will offend?

    Besides the silliness of the entire question a moment's thought tells us that the adjective pinkie must refer to something other than skin color since of course if it was in reference to pigmentation it wouldn't single out one of the five fingers. My father-in-law informs me that the word "pinkie" or "pinky" originally referred to something small or insignificant and was also used to describe small eyes or eyes half shut. My daughter's teacher can rest at ease.

    Part of the entry from the Oxford English Dictionary Online follows for those interested.

    pinkie, adj. and n.1 DRAFT REVISION Dec. 2005


    Brit. /pki/, U.S. /pki/ Forms: 17- pinky, 18- pinkey, 18- pinkie. [ PINK n.6 + -Y suffix6. Much earlier currency (from the 16th cent.) is app. implied by forms at PINKANY n.
    With sense A. cf. earlier PINK n.5, PINKING adj.1

    With sense B. 2 cf. Dutch pinkje little finger (1717 or earlier; pink in the same sense (1599 as pinck; of unknown origin, perh. originally children's language) + -je, diminutive suffix).]


    A. adj. Chiefly Sc. Small, tiny. Of the eyes: narrow, winking, half-shut. Cf. PINK n.5, PINKANY n.
    Sc. National Dict. s.v. pink records this sense as still in use in Lothian in 1965.


    1718 A. RAMSAY Christ's-kirk on Green II. 16 Meg Wallet wi her pinky Eeen, Gart Lawrie's Heart-strings dirle. 1808 J. JAMIESON Etymol. Dict. Sc. Lang., Pinkie, a term applied to small eyes. 1818 W. MIDFORD Coll. Songs 31 A bussy-tailed pinkey wee Frenchman. 1825 J. JAMIESON Etymol. Dict. Sc. Lang. Suppl. s.v., Pinkie Een, eyes that are narrow and long, and that seem half closed. 1923 G. WATSON Roxburghshire Word-bk. 235 A pinkie bairn.
    B. n.1


    1. Sc. Something very small or insignificant; a tiny thing. Now rare exc. in sense B. 2.


    1808 J. JAMIESON Etymol. Dict. Sc. Lang., Pinkie, the smallest candle that is made. 1923 G. WATSON Roxburghshire Word-bk. 235 Pinkie, anything very small.
    2. colloq. (orig. Sc.). The little finger. Also (occas.): the little toe.


    1808 J. JAMIESON Etymol. Dict. Sc. Lang., Pinkie, the little finger; a term mostly used by children, or in talking to them. 1828 D. M. MOIR Life Mansie Wauch i. 12 His pinkie was hacked off by a dragoon. 1898 J. PATON Castlebraes ix. 297 Raither..than lift yae wee pinkie tae save that Deevilish man. 1935 J. CORRIE Income 11 Then the pinkie took sair, and puir Sandy was left wi' a fit without ony taes. 1948 Richmond (Va.) Times-Dispatch 15 Mar. 17/4, I grip the ball with my thumb and pinky. 1965 E. TUNIS Colonial Craftsmen vi. 140 Even the most elegant lady poured tea or coffee from her cup into her saucer to cool and then, with delicately extended pinkie, drank it from the saucer. 1973 J. MARKS Mick Jagger (1974) 11 As for Mick, he splashes on some fragrance and checks his eyeliner with his pinkie. 2002 A. PHILLIPS Prague vii. 323 He brushed the wax crumbs away with speedy sweeps of his right pinkie.

    Thursday, October 05, 2006

    Enhanced Gameday

    For the playoffs MLB.com is now offering it's enhanced GameDay system. What's so cool is that it includes pitch speed and trajectory information using new equipment installed in a few of the ballparks that I'm thinking works in much the same way as K-Zone does with cameras connected to servers that triangulate the location of each pitch and send their results to a central processor. Both in San Diego and at Yankee Stadium things seem to be working well.

    I especially like the pitch release point indicator as well as the two different velocities associated with each pitch that show both the "muzzle velocity" and the speed at which the pitch crosses the plate.

    Tuesday, October 03, 2006

    Dodgers 2006

    I've been spending the last couple days thinking about the Padres/Cardinals series since I'm writing a piece on it for Baseball Prospectus (incidentally the Padres in four but that's probably not surprising given what others are saying) but I thought it would be interesting to take a look at the season the Dodgers had from a graphical perspective.


    As you'll recall they lost 13 of 14 from July 13th through the July 26th and then immediately won 17 of 18 through August 15th to go from 8 games under .500 to 8 games over. They also won 9 of their last 10 to finish at 88-74. You can see the hug red V in the middle of their season that tracks their streaks and notice that poor run scoring was more prominent in their slide and better run prevention more responsible for their winning streak as their offense basically held steady since the end of July. With the loss of Pedro for the Mets and the addition of Maddux for the Dodgers I think the New Yorkers are going to have their hands full.