
Congrats to Ryno! 
Always a class act on and off the field. Here's a nice article on the scouting and signing of both Sandberg and Boggs by Tracy Ringolsby.
Sunday, July 31, 2005
Ryno's in the House
3 Nights in August
Prompted by a review I read on 360thePitch.com I went out and bought the book 3 Nights in August: Strategy, Heartbreak, and Joy Inside the Mind of a Manager by Buzz Bissinger, the author of Friday Night Lights.
As many of you already know the book covers in detail the three game series between the Cubs and Cardinals at Busch Stadium from August 26-28, 2003 as told from the perspective of Tony La Russa. I found it interesting that Bissinger was actually approach by La Russa to write the book in November of 2002 and that originally it was to be written in La Russa's voice. After getting into it Bissinger and La Russa opted for telling the story in a more narrative fashion and instead of looking at an entire season, focused on a particular three game series. This approach seemed to work very well since it allowed for more in-depth sidetrips from the central story that a book devoted to an entire season probably could not have done. And by focusing on just three games Bissinger was able to capture specific moments and strategies that let give you a view into La Russa's mind.
I was also interested in the book for a more personal reason. That week in August I was in St. Louis for a series of meetings with my good friend Jon Box, a life long Cardinals fan from Memphis. Our supervisor at Quilogy, John McCartan was able to secure some nice seats for the third game and so John, me in my Cubs attire and Jon in his Cardinals garb took in the game and, although the game was so unceremoniously ended by Kerry Robinson's leadoff homerun in the bottom of the ninth, we had a great time talking baseball and enjoying the atmosphere of that important game. I also liked the book because knowing the outcome as I did I knew that Bissinger was going to pay particular attention to Robinson and indeed Bissinger developed a very interesting back story about Robinson's attitude and La Russa's disappointment in Robinson's failure to execute the fundamentals earlier in the series as well as earlier in the season.
Overview
As you would imagine the book is broken into three roughly equal parts for each game. Along the way Bissinger includes sections of the chapters devoted to game one on La Russa's history in baseball and the sacrifices he's made as well, a profile of Mark Prior, Cardinals video guru Chad Blair, Rick Ankiel, and Dave Duncan La Russa's pitching coach. The Cubs took game one 7-4 behind a strong outing by Prior and third inning homeruns by Randall Simon and Aramis Ramirez off of Garrett Stephenson.
In the section devoted to game two Bissinger spends a bit less time on the game itself and more on the back story and strategies of La Russa. I found particularly interesting his discussion of La Russa's philosophy regarding beanballs and how in a series in Arizona he ordered his pitcher to hit Luis Gonzales in response to a pitch near the head of Tino Martinez. What fascinated me was that La Russa ordered an intentional walk to Junior Spivey with two outs and a 1-2 count in a 1-0 game in the top of the eighth in order to ensure that Gonzales batted in the ninth. He then had Jeff Fasero hit Gonzales in the ninth with two outs. The Cardinals lost the game 1-0. Bissinger says of the mindset of La Russa:
"La Russa knew that he had possibly affected the game's outcome for the sake of retaliation. He also realized that his friendship with Gonzales might suffer...He still didn't like what he had done...He knew that if he didn't protect his players, didn't stand up for them, the respect they gave him...would crumble away. [Paul] Richards had told him that sometimes, you have to be willing to lose a game to win more later. And this, La Russa had concluded, had been one of the those times."
The implication is that somehow the team would lose more games in the future if they didn't think that La Russa was protecting them. While there may be a temporary reaction, surely the players (and a veteran like Martinez especially) understand that winning the game should be the first priority of a manager. After all, its not as if the Cardinals will never play the Diamondbacks again. In contrast, elsewhere in the book Bissinger makes it clear that La Russa has had to tell players that winning comes first and so they have to understand that La Russa is working for the good of the team when they are pinch hit for or taken out for a reliever. It seems to me that a manager should inculcate in his team that it is his first job is to win the game at hand and any other issue has to take a back seat. Once another issue takes precedence it would seem to invite a slippery slope.
In the second section Bissinger also includes short profiles of J.D. Drew and La Russa's struggles with trying to get him to perform up to his potential and juxtaposes that with Albert Pujols who came out of nowhere to quickly become the league's best hitter. The most interesting profile, however, is of Cal Eldred and his comeback from elbow problems to pitch effectively out of the bullpen. There is included La Russa's take on steroids in the game (he suspected something says Bissinger but apparently didn't do anything) which includes a short defense of Mark McGwire that rings hollow in the wake of the hearings earlier this summer where McGwire all but admitted his use of steroids. The second game is a pitcher's duel between Kerry Wood and Woody Williams that ends with a 4-2 Cardinals victory on the strength of four runs in eighth courtesy of a Kyle Farnsworth implosion.
In section three Bissinger devotes a lot of time to the intertwined stories of Matt Morris and Darryl Kile as Morris struggled through injuries in 2003 in the wake of Kile's death in June of 2002 in a Chicago hotel room. And of course this section, and the book, culminates with the redemption of Kerry Robinson who homered off Mike Remlinger to seal the 3-2 victory in the third game. The homer was Robinson's first and only of the season and just the third of his career. He also doubled in the 6th to plate the first Cardinals run. Incidentally, one of the reasons Robinson was in La Russa's doghouse was that he had repeatedly failed to be aggressive in RBI situations. La Russa preaches that in those situations the hitter should attack the first good pitch. I was surprised to find that this even applies to bases loaded situations such as the one Scott Rolen found himself in during the series. While I certainly didn't like the outcome of the game or the series, the game was well played and well pitched by Carlos Zambrano and included a solo homerun by Sammy Sosa in the first inning off of Morris on a hanging slider.
Issues
There were also three issues in the book I wanted to address.
First, I found it interesting that La Russa prepares a series of index cards before each series that details in his own shorthand the matchups of his hitters against the opposing pitcher and vice versa (e.g. his card will say Karros 8-29-1, Sosa 2-14-1 representing hits, at bats, and homeruns against his starting pitcher). These are the cards he keeps in his back pocket and refers to periodically throughout the game. Bissinger implies that he takes great stock in these cards but doesn't acknowledge that in many cases the sample sizes are likely too small to matter. The cards also do not include walks, strikeouts, or even extra base hits besides homeruns as you might expect given the constrained space. It would seem to me that a major league team should have at its disposal in a more meaningful form a complete statistical record of each plate appearance against a particular pitcher accessible in the dugout. Although they do have video as Bissinger discusses, the video is used primarily by hitters before the game to analyze their approach against a particular pitcher and by Dave Duncan to analyze opposing hitters for pregame meetings. Wouldn't it make sense to have a notebook computer in the dugout that could tell you, for example, that in going 3 for 8 against a particular pitcher two of those hits were dribblers in the infield and the third a pop-fly to short right? That kind of information could be condensed into a score or rating for each matchup based on sample size, hit location, and how hard the ball was hit.
Second, Bissinger talks in the preface about the impact of Moneyball on the game. He notes that
"front offices are increasingly being populated by thirty-somethings whose most salient qualifications are MBA degrees and who come equipped with clinical ruthlessness: The skills of players don't even have to be observed but instead can be diagnosed by adept statistical analysis through a computer...It is wrong to say that the new breed doesn't care about baseball. But it's not wrong to say that there is no way they could possibly love it...They don't have the sense of history, which is to the thirtysomethings largely bunk."
This seems more than a bit like a straw man to me. As I said in my review of Scout's Honor, there is a place for both scouting and statistics in their proper roles. No team in their right mind would forsake one completely for the other and the thirtysomethings like Paul DePodesta and Theo Epstein certainly don't. Performance analysis is about understanding how to properly value a player's contribution in all aspects of the game given the inherent structure of baseball coupled with how to project performance when data is available. The discussion in Moneyball focused on using the results of performance analysis to capitalize on undervalued skills. Plate discipline is therefore a by product of the philosophy not its raison d'etre. Never is it the case, especially at the lower levels, where observation is discarded.
It's also a cheap shot to say that those who value performance analysis can't love the game or that they don't value history. The first claim is simply an ad hominum attack and the second is refuted by the fact that the performance analysis crowd in one sense values history more than the tools-only guys. After all, critics like Leonard Koppett have often accused stat heads of dwelling on the past because statistics record what has happened, not what will happen.
Bissinger also says that his book was not conceived as a response to Moneyball since work on it began before La Russa or he had heard of Michael Lewis. That said, there are at least two points in the book where he takes a crack at Lewis and the "thirtysomethings".
The first is a short discussion of on base percentage that I alluded to in another post. The long and short of it is that Bissinger is using a caricature of Moneyball by suggesting that on base percentage is valued over every other statistic and in every situation in the same way that Bill Shanks did in Scout's Honor. La Russa appears from Bissinger's description to rightly understand the value of on base percentage but also the value of playing the scoreboard. Like so many of the attacks on Moneyball this one rings extremely hollow.
He also takes a shot at Bill James and the Red Sox.
"...he gave his little conspiratorial laugh in spring training when he heard of the Red Sox plan, based on analysis by statistical guru and team consultant Bill James to have rotating closers instead of one designated pitcher. James, in part because of what he felt was the inflated statistic of the save...believed that it wasn't always necessary to bring in a classic closer to pitch the ninth. La Russa respected James, but based on managing nearly 4,000 games, was convinced that James was wrong. La Russa was also right: the Red Sox ultimately dumped the idea when it became clear that closer-by-committee was no-close-by-committee."
Unfortunately, the name "closer by committee" was given to the experiment way back in January of 2003 or before and implied that there would be some kind of rotation as Bissinger alludes to. Actually, Epstein said of the idea in early February:
"The 'closer by committee' concept (if we must call it that) has more to do with usage than it does with personnel. We still want a truly dominant reliever (or two, or three, or four). We just won't hold him back for the ninth inning so he can chalk up a save. The goal is to put the best pitcher in the game to get the most critical outs, period."
The problem was not with the concept or the Red Sox desire to acquire dominating relievers. The fact is that they could not acquire Ugueth Urbina and instead relied on a group of relievers who had closed before including Ramiro Mendoza, Bobby Howry, Mike Timlin, Alan Embree, and Chad Fox. The idea was not to rotate the closer duties but rather to use the appropriate pitcher for the situation instead of saving one guy to pitch only in the 9th. As Epstein also said:
"I'll leave it up to Grady to find usage patterns in the pen...(But) the way we've built the pen is with versatility and flexibility in mind. On any given day, we want Grady to have lots of options to attack game situations and opposing lineups.''
This makes perfect sense given that the Sox appeared to have a solid bullpen in these guys. However, when Mendoza blew a 4-1 lead in the 9th inning of the first game of the season and Fox and Embree did likewise, all before the 8th of April, you knew that the experiment wouldn't last. Like the four-man rotation the idea of using several good relievers to close out games as opposed to one dominating one is an idea whose time will come again. Some team will try it out of necessity and it'll work.
Finally a small criticism. I found some of Bissinger's writing a bit forced. In an effort to spice up the narrative he occasionally resorts to some analogy or metaphor to describe a baseball situation that comes off sounding a bit cheesy.
Conclusion
But despite these few problems I really did like the book. La Russa comes off as a guy who has perhaps sacrificed too much in terms of family to get where he is, but one who really cares about both his players and about winning. You get the impression that when the game is over La Russa has left no stone unturned. And I especially enjoyed the descriptions of La Russa's thought patterns as the games unfolded and how he was thinking ahead to matchups several innings down the road. In one insight that I didn't realize many managers were aware of (at least Dusty Baker) La Russa chose to stay with a left-handed hitter against Mike Remlinger because he knew that Remlinger was a reverse left-hander - meaning one that is more effective against right-handed than left-handed hitters. Those kinds of little things permeate the book and make it well worth reading for any baseball fan.
Thursday, July 28, 2005
Baserunning Correction
A small correction to my article on baserunning. The example I give of calculating the expected number of bases in a given situation was for an older version of the table I provided in the article.
It should have been:
2.25 = (.498 * 2) + (.441 * 3) + (.063 * -2)
For 2 out situation when the runner is on first (not second as the article says) and the batter doubles to left.
In addition, I mistakenly said that John Dewan co-founded STATS, Inc. and was in on the creation of Project Scoresheet. Actually, Project Scoresheet started in 1984 with Dewan becoming the Executive Director in 1987. He then joined STATS, Inc., which was founded a few years earlier by Dick Cramer. Dewan was instrumental in getting STATS to score games for profit just as Project Scoresheet had been doing but not for profit. Cramer eventually left STATS and Dewan became the President and CEO. In 2002 Dewan founded Baseball Info Solutions.
I was recalling what I had read in By The Numbers since my copied was loaned out and not returned, which shows how dangerous such a practice can be, and simply neve rechecked my facts. Thanks to Greg Spira for pointing these out.
Baserunning 2000-2004
To go along with my article on updating the baserunning framework published on The Hardball Times, here are the 177 qualifying runners with 100 or more opportunities from 2000-2004 sorted by IBP.
Name Opp Bases EB IB OA IBP
1 Jack Wilson 117 203 179 24 1 1.14
2 Mike Cameron 168 286 252 34 2 1.14
3 Raul Mondesi 112 190 168 22 1 1.13
4 Chris Singleton 112 192 171 21 2 1.12
5 Juan Pierre 259 411 367 44 4 1.12
6 Vernon Wells 104 175 157 18 4 1.12
7 Jay Payton 168 280 252 28 3 1.11
8 Ray Durham 203 334 301 33 0 1.11
9 Torii Hunter 170 279 252 27 3 1.11
10 Cristian Guzman 209 349 315 34 3 1.11
11 Carlos Beltran 208 346 313 33 0 1.10
12 David Eckstein 216 352 319 33 3 1.10
13 Jimmy Rollins 180 297 269 28 1 1.10
14 Jose Valentin 139 232 211 21 2 1.10
15 Barry Larkin 140 237 216 21 0 1.10
16 Luis Castillo 272 450 410 40 4 1.10
17 Larry Walker 173 288 263 25 2 1.10
18 Tony Womack 194 313 286 27 5 1.10
19 Royce Clayton 134 232 212 20 2 1.09
20 Rafael Furcal 201 329 301 28 2 1.09
21 Edgar Renteria 210 338 310 28 4 1.09
22 Orlando Cabrera 162 273 250 23 2 1.09
23 Brian Roberts 124 197 180 17 2 1.09
24 Alfonso Soriano 118 185 170 15 2 1.09
25 Steve Finley 194 320 295 25 2 1.09
26 Luis Rivas 137 223 206 17 1 1.08
27 Carlos Guillen 176 285 263 22 1 1.08
28 Alex Rodriguez 209 345 319 26 6 1.08
29 Melvin Mora 185 304 281 23 5 1.08
30 Jeff Cirillo 123 204 189 15 5 1.08
31 Cesar Izturis 123 194 180 14 1 1.08
32 Johnny Damon 256 420 390 30 3 1.08
33 Marquis Grissom 131 213 198 15 2 1.08
34 Eric Chavez 176 287 267 20 1 1.07
35 Darin Erstad 210 348 325 23 6 1.07
36 Scott Rolen 209 347 324 23 2 1.07
37 Michael Young 148 238 223 15 2 1.07
38 Andruw Jones 206 338 317 21 4 1.07
39 Albert Pujols 174 287 269 18 6 1.07
40 Derek Jeter 248 399 375 24 2 1.07
41 Todd Helton 230 384 361 23 4 1.06
42 Brian Giles 199 321 302 19 2 1.06
43 Eric Hinske 106 169 159 10 2 1.06
44 Preston Wilson 120 192 181 11 2 1.06
45 Terrence Long 181 285 269 16 2 1.06
46 Reed Johnson 111 173 163 10 1 1.06
47 Neifi Perez 156 253 239 14 3 1.06
48 Kenny Lofton 206 322 305 17 5 1.06
49 Gabe Kapler 120 189 179 10 4 1.06
50 Ron Belliard 196 302 286 16 4 1.05
51 Chipper Jones 203 327 310 17 3 1.05
52 Jeff Bagwell 214 347 330 17 2 1.05
53 Jose Offerman 122 195 185 10 4 1.05
54 Raul Ibanez 132 215 204 11 2 1.05
55 Aaron Boone 110 169 161 8 1 1.05
56 Rey Sanchez 145 219 210 9 4 1.04
57 Roberto Alomar 183 286 274 12 2 1.04
58 Randy Winn 191 297 285 12 2 1.04
59 Sean Burroughs 108 165 158 7 2 1.04
60 Mark Grudzielanek 185 283 272 11 5 1.04
61 Jacque Jones 203 313 301 12 4 1.04
62 Placido Polanco 194 311 299 12 4 1.04
63 Ellis Burks 101 152 146 6 0 1.04
64 Corey Koskie 157 256 247 9 3 1.04
65 Ichiro Suzuki 246 364 351 13 2 1.04
66 Aubrey Huff 159 242 234 8 4 1.04
67 Ryan Klesko 187 292 282 10 3 1.04
68 David Bell 120 186 180 6 3 1.04
69 Todd Walker 180 280 271 9 4 1.03
70 Jason Kendall 257 400 387 13 2 1.03
71 Eric Young 190 285 277 8 6 1.03
72 Shea Hillenbrand 135 208 202 6 2 1.03
73 Hideki Matsui 107 173 168 5 3 1.03
74 Bobby Higginson 181 274 267 7 3 1.03
75 Carlos Lee 199 318 310 8 2 1.03
76 J.D. Drew 153 244 238 6 5 1.03
77 Adam Kennedy 185 286 279 7 2 1.03
78 Miguel Tejada 206 331 323 8 8 1.03
79 Troy Glaus 115 180 176 4 2 1.02
80 Fernando Vina 171 256 250 6 3 1.02
81 Ivan Rodriguez 152 230 225 5 2 1.02
82 Michael Tucker 139 217 212 5 3 1.02
83 Roger Cedeno 125 189 185 4 6 1.02
84 Edgardo Alfonzo 189 289 283 6 3 1.02
85 Derrek Lee 172 261 256 5 3 1.02
86 Gary Sheffield 204 319 313 6 3 1.02
87 Jeff Conine 161 243 239 4 7 1.02
88 Bernie Williams 215 334 329 5 1 1.01
89 D'Angelo Jimenez 157 231 228 3 5 1.01
90 Jim Edmonds 196 289 286 3 6 1.01
91 Desi Relaford 137 206 204 2 3 1.01
92 Omar Vizquel 205 313 310 3 4 1.01
93 Trot Nixon 148 213 212 1 4 1.01
94 Magglio Ordonez 156 237 235 2 5 1.01
95 Brad Wilkerson 130 191 190 1 4 1.01
96 Milton Bradley 107 165 164 1 3 1.00
97 Vladimir Guerrero 151 234 233 1 5 1.00
98 Barry Bonds 241 351 350 1 2 1.00
99 Rondell White 129 194 194 0 7 1.00
100 Aramis Ramirez 123 185 185 0 1 1.00
101 Bret Boone 172 262 262 0 6 1.00
102 Jose Guillen 101 154 155 -1 5 1.00
103 Shawn Green 207 309 310 -1 5 1.00
104 Jose Vidro 197 298 299 -1 6 1.00
105 Cliff Floyd 156 239 240 -1 1 0.99
106 Julio Lugo 197 301 303 -2 5 0.99
107 Mark Kotsay 196 292 294 -2 5 0.99
108 Jeromy Burnitz 160 242 244 -2 4 0.99
109 Mike Lamb 111 164 165 -1 1 0.99
110 Ricky Gutierrez 104 148 149 -1 3 0.99
111 Scott Hatteberg 127 179 181 -2 3 0.99
112 Craig Biggio 241 357 360 -3 5 0.99
113 Tim Salmon 162 243 246 -3 1 0.99
114 Erubiel Durazo 117 169 171 -2 1 0.99
115 Matt Lawton 209 311 315 -4 8 0.99
116 Bobby Abreu 210 314 319 -5 10 0.99
117 Nomar Garciaparra 171 257 262 -5 1 0.98
118 Deivi Cruz 121 181 186 -5 3 0.98
119 Mark McLemore 129 188 193 -5 4 0.97
120 Jermaine Dye 156 232 239 -7 5 0.97
121 Mark Loretta 199 285 294 -9 5 0.97
122 Mike Sweeney 212 308 318 -10 4 0.97
123 Shannon Stewart 246 345 357 -12 4 0.97
124 Ramon Hernandez 128 185 191 -6 2 0.97
125 Jeff Kent 193 283 294 -11 7 0.96
126 Pat Burrell 154 224 233 -9 4 0.96
127 Sean Casey 186 269 280 -11 5 0.96
128 Garret Anderson 203 298 311 -13 0 0.96
129 Scott Spiezio 186 271 283 -12 6 0.96
130 Jose Hernandez 110 158 165 -7 4 0.96
131 Lance Berkman 243 344 359 -15 8 0.96
132 Brad Ausmus 145 210 220 -10 4 0.96
133 Richard Hidalgo 149 210 220 -10 3 0.95
134 Moises Alou 146 212 223 -11 4 0.95
135 Todd Zeile 149 209 220 -11 2 0.95
136 Brent Mayne 106 148 156 -8 2 0.95
137 Paul Konerko 182 261 275 -14 4 0.95
138 Sammy Sosa 203 289 305 -16 4 0.95
139 Paul LoDuca 112 161 170 -9 4 0.95
140 Vinny Castilla 145 207 220 -13 7 0.94
141 Luis Gonzalez 222 320 340 -20 6 0.94
142 Tino Martinez 171 242 257 -15 3 0.94
143 Alex Gonzalez 123 172 183 -11 6 0.94
144 Jason Giambi 165 236 252 -16 4 0.94
145 Jim Thome 222 312 334 -22 5 0.93
146 Phil Nevin 142 191 205 -14 4 0.93
147 Craig Counsell 141 192 206 -14 9 0.93
148 B.J. Surhoff 152 206 222 -16 7 0.93
149 Adrian Beltre 156 212 229 -17 6 0.93
150 Geoff Jenkins 102 157 170 -13 4 0.93
151 Manny Ramirez 191 270 292 -22 8 0.92
152 Tony Batista 176 247 268 -21 8 0.92
153 Joe Randa 215 302 328 -26 7 0.92
154 Rich Aurilia 132 181 197 -16 5 0.92
155 Mike Lowell 176 249 271 -22 7 0.92
156 Doug Mientkiewicz 150 215 237 -22 7 0.91
157 David Ortiz 150 202 223 -21 4 0.91
158 Dan Wilson 132 172 190 -18 2 0.90
159 Travis Lee 150 202 224 -22 8 0.90
160 Juan Encarnacion 169 228 253 -25 10 0.90
161 Mike Piazza 116 159 177 -18 3 0.90
162 Kevin Millar 127 179 199 -20 3 0.90
163 Ben Grieve 136 186 208 -22 5 0.89
164 Carlos Delgado 237 324 362 -38 8 0.89
165 Jason Varitek 143 200 224 -24 2 0.89
166 Rafael Palmeiro 207 273 307 -34 8 0.89
167 Jorge Posada 139 187 210 -23 4 0.89
168 Edgar Martinez 178 238 269 -31 3 0.89
169 Bill Mueller 191 256 293 -37 10 0.87
170 John Olerud 195 248 285 -37 7 0.87
171 Richie Sexson 151 203 233 -30 7 0.87
172 J.T. Snow 150 202 233 -31 5 0.87
173 Fred McGriff 110 140 161 -21 2 0.87
174 Frank Thomas 121 158 182 -24 5 0.87
175 Mike Lieberthal 130 165 192 -27 4 0.86
176 Dmitri Young 139 185 217 -32 9 0.85
177 Ben Molina 138 177 208 -31 4 0.85
Outscored Part II
A fellow SABR member informs me that the AL West in 1984 and 1994 are the only two times where the entire division was outscored by their opponents. In 84 the Royals won the division with an 84-78 record while the Angels and Twins were both 81-81. There were seven teams in the division back then and so it would seem the feat would be "more" impressive.
In 1994 of course there were only four teams in the AL West and the Rangers won the strike shortened division title with a 52-62 record.
Monday, July 25, 2005
Nats Should Go West
With the Nats now struggling to keep pace with the Braves I noticed that their record in one-run games is 24-14. While still good, not long ago it stood at 22-7 and so they've recently gone 2-7. Since they have trouble scoring runs they also have played the most one-run games in the majors. With a pythagorean record of 47-51 I wouldn't expect them to be able to keep pace.
In other news the Padres have now lost 7 in a row which means that every team in the NL West has been outscored by their opponents.
WEST           W  L  PCT  GB  HOME  ROAD  RS  RA   STRK L10
San Diego     50 49 .505 -   29-18 21-31 432 442 Lost 7 3-7
Arizona       48 52 .480 2.5 25-28 23-24 438 526 Won 1  5-5
LA Dodgers    44 54 .449 5.5 23-23 21-31 419 465 Lost 2 4-6
San Francisco 42 55 .433   7 22-30 20-25 431 505 Lost 2 5-5
Colorado      34 63 .351  15 24-23 10-40 419 542 Lost 2 3-7
I doubt that's ever happened before. Good thing they play each other or this could be really ugly.
More Braves
Up late watching the tape of the Cubs/Cards game tonight and perused this interview of Kevin Goldstein on Baseball Digest Daily. In regards to Scout's Honor I found this exchange interesting:
"BDD: It’s no surprise that whichever organization we talk to, they love their minor league system. Can you compare and contrast the Red Sox, Dodgers, and Braves systems, highlighting their strengths and weaknesses? I ask about these three teams because we’ve had the opportunity recently to speak with members of their organizations.
KG: Sure. The Red Sox system has certainly taken a step forward, particularly in terms of pitching, with Jon Lester, Jon Papelbon and Anibal Sanchez all having seasons one could categorize as breakout. So while it’s an improving system and they have every reason to happy, they’re still not in the same league as the Dodgers or Braves. The Dodgers have one of the best systems in baseball and the Braves, well, we’ve seen most of their prospects at the major league level recently. They also do a remarkable job of scouting and development – it seems like they’re always loaded with prospects."
Thursday, July 21, 2005
Walk-Off Balk
Last week (July 15th) Mike Stanton of the Nationals committed a balk that ended the game in Milwaukee's 4-3 victory. Sensing that this was a rarity some industrious SABR members have dug a bit and found the following other instances where a walk-off balk occurred:
Mike DiMuro called the balk.
And who says baseball isn't endlesss fascinating?
BIP Chart
For an article I wrote for The Hardball Times on Sean Burroughs and Mark Teahen I also wrote a program called BIP Chart to display the balls put in play distribution for all players in 2003 and 2004. It is a windows application that requires the .NET Framework. 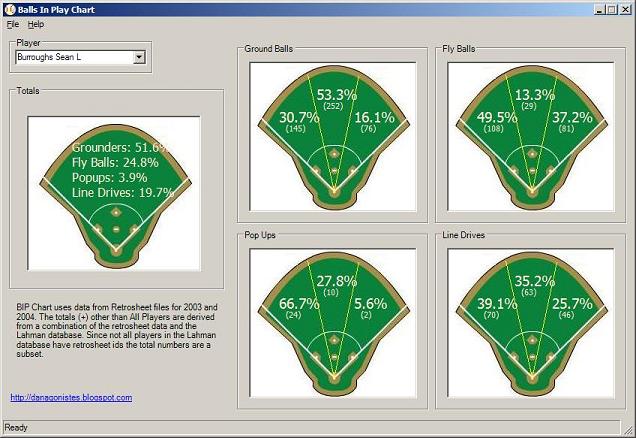
You can download the application from here. If you don't have the .NET Framework you can download it from here or get it using Windows Update. The raw data in the form of a comma delimited file is also included in the installation directory so you can load it in Excel and do your own analysis. Have fun.
Tuesday, July 19, 2005
Quick Takes on Trades
Well, the Rockies and Cubs have both made some deals in the last week I just wanted to comment on...
Cubs acquire Jody Gerut from the Indians for Jason Dubois
Gerut had a fine rookie season in 2003 at the age of 25 (.279/.494/.336) after being drafted by the Rockies in the second round in 1998. Gerut led the Indians in homeruns and RBIs and all rookies in OPS (830). He finished fourth in the Rookie of the Year race. However, like another Indians rookie Joe Charboneau in 1980, he suffered a setback in 2004 (.252/.405/.334) and underwent reconstructive knee surgery on September 27th. He came back from the surgery a little earlier than expected this season but has shown no power (1 homeruns in 138 AB) while posting a .275/.377/.357 line. While he came up as a center fielder but played most of his games in 2003 and 2004 in right field there is no chance he'll play that position again with his injury. He's was a better than average right fielder in the past so it'll be interesting to see how the injury affects his range. I like his plate discipline but am worried that he won't regain his power stroke after the injury. However, since his injury was severe it may take a full year to recover.
Dubois was hitting .239/.472/.289 in 149 plate appearances at the time of the trade although he was used so inconsistently that it's tough to tell whether he'll really develop or not. He has shown little plate discipline throughout his career and swings through alot of breaking balls down in the zone. He struck out a third of the time. Still, it would have been nice to see him regularly installed in left field just to see what he could do since he has done nothing but hit at every level in the minors. Of course, that presupposes that he could actually hold down left field. He's not much of a defender and is better suited as a DH. Dusty Baker, as we all know, has an aversion to playing rookies despite his recent comments to the contrary and so I guess Hendry's feeling is that you might as well trade them.
Gerut is three years older than Dubois at 24 but it doesn't seem to me that either team gained a big advantage. The Cubs get another left handed at bat although with Todd Hollandsworth already installed in left, what they really needed was a platoon partner for this season. Dubois could have filled that role but got only 62 plate appearances against lefties before the deal with a SLUG of .482. The Cubs are probably looking at Gerut for the long haul but in left or right but he'll only be useful if his power comes back. The Indians got a younger player without a history of injury that may just develop into a big power hitter. More upside but Dubois needs to develop some plate discipline in order to be useful. The Cubs probably got another fourth outfielder with a chance to become a regular. Verdict: Too early to tell but I'd give the nod to the Indians.
Rockies acquire Zach Day and J.J. Davis from the Nationals for Preston Wilson
For the Rockies lets hope this was all about salary dump. The Nats will pick up $2M of the remaining $5.58M on Wilson's contract in addition to a minor league player to be named later or more cash. In Day and Davis I doubt the Rockies add anything to their puzzle for the long term. Day was a better than league average starter in 2003 and 2004 in 41 starts before being injured. I think the Rockies like him because of the 2.77 and 1.96 GO/AO ratios he posted those two seasons thinking that will help him in Coors Field. Still, he gave up 13 homeruns in 116.7 innings in 2004. What I don't like about him is that his career strikeout to walk ratio is abysmal (1.12) and his K/9 sits at just 4.58. Guys with ratios like these do not generally have long careers as the Royals are discovering with Jimmy Gobble. In addition, I'm not convinced that ground ball pitchers have more success at Coors Field than others. The larger outfield and the fast infield would seem to dictate against it. This season of course Day has been awful, walking 27 in 37 innings. He'll pitch out of the pen for now. J.J. Davis has been something of an enigma. A big guy (6'4" 250), drafted as the 8th overall pick of the Pirates in 1997, who has played at all levels hitting .262 in his minor league career with 112 homeruns in over 2,400 plate appearances. He seemed to have something of a breakthrough season in 2003 hitting 26 homeruns in Nashville. He was then injured for much of 2004 and picked up 26 at bats for the Nats this season and hit 12 homeruns in 51 games for New Orleans while hitting .282. He'll be 27 in October. He also lacks plate discipline and chases breaking balls. He was sent to Colorado Springs where I saw him play for the Sky Sox last night in their double header. He didn't look very good at the plate and has struggled thus far (1 for 16 with 8 ks).
Verdict: Obviously, the Nats are looking to solidify their ever-shrinking lead in the AL East and hope that Wilson can make a difference. If he does and they win their division then the advantage will be theirs since I doubt the Rockies will see much from Day and Davis.
Rockies acquire outfielder Eric Byrnes and shortstop Omar Quintanilla from the A's for starter Joe Kennedy and reliever Jay Witasick
This was the most interesting of the three deals and it all hinges on Quintanilla.  He was drafted out of Texas as a supplemental pick in the first round by the A's in 2003 and has done nothing but hit thus far posting a career .330 average in 171 professional games. Before this season he was listed as the A's 8th top prospect by Baseball America. He's a line drive hitter with pretty good pop (60 extra base hits last season between A and AA) although he's very aggressive and therefore walked only 47 times in 600 at bats. He's also only an average runner. He does hit left handed which is interesting. In the field he's got soft hands but only average quickness and arm strength which means that the Rockies are probably looking at him as a second baseman. That would be welcome given that Aaron Miles now occupies the spot.
As for Byrnes, he's a fourth outfielder on a team that may have three of them already (Matt Holliday, Brad Hawpe, and Corey Sullivan). Obviously, the Rockies are hoping that Holliday and Hawpe will develop but that remains to be seen. I would expect Jay Witasick to continue to pitch well as he has since the second half of 2001. Joe Kennedy had been a big disappointment in Denver this year by posting a 7.09 ERA at home and 7.01 on the road. His walk rate increased and his strikeout rate decreased dramatically this season. Even if he does right the ship his career performance projects as a fourth or fifth starter at best.
Verdict: It all depends on Omar.
Addition: Check out this analysis of the Gerut/Dubois trade. It puts Gerut's lack of isolated power in context and shows him to be more like a singles hitter who had a few good weeks. The advantage for the Indians is growing...
Friday, July 15, 2005
Cubs Pitching
Here's a little good news for Cubs fans on the pitching front (in addition to the excellent back to back starts by Mark Prior and Kerry Wood that has the Cubs on a five-game winning streak). First round draft choice Mark Pawelek has pitched 12 scoreless innings thus far in pro baseball in the Arizona Rookie league. He's also fanned 19, walked 6, and given up 5 hits. Strangely, with his 0.00 ERA he's 0-2 having given up 3 unearned runs. So far so good.
Lineup Construction
Before Corey Patterson was sent down to the minors the Cubs once again were struggling with lineup construction - even hitting Patterson leadoff by his own request and regularly placing Neifi Perez and Jose Macias near the top of the order. Lineup construction is interesting to me because it's one of those things that your intuition tells you must be one way when hard data shows something else. In other words, while it seems like it must be important to find just the right order to maximize runs, it turns out that almost any possible lineup scores just about the same number of runs.
This conclusion regarding lineup construction was reinforced this week in a study published on Retrosheet by Tom Ruane entitled "Evaluating Traditional Lineups". In the study Ruane used a Markov chain (Markov chains have been used many times over the years to study baseball since they work with state transitions such as those present in baseball where each at bat begins in one of 24 possible states and ends in one of 25 states) to model lineup construction using data from 1993 through 2004. Using this data he analyzed 362,880 difference lineup combinations and was looking to see if there were any non-traditional lineups that produced more runs than the traditional ones.
For the NL the top producing lineups over 8 innings turned out to be:
 RUNS  ----- LINEUP ----
 4.143  1 3 2 5 4 6 7 9 8
 4.142  1 3 2 5 4 6 8 7 9
 4.142  1 3 4 2 5 6 7 9 8
 4.142  1 3 4 5 2 6 7 9 8
 4.140  1 3 4 2 5 6 8 7 9
 4.140  1 3 4 5 2 6 8 7 9
 4.139  1 3 2 5 4 6 7 8 9
 4.138  1 2 4 3 5 6 8 7 9
 4.138  1 2 5 3 4 6 8 7 9
 4.138  1 3 4 5 6 2 7 9 8
Whereas the traditional lineup scored 4.127 runs. For the AL, where the traditional lineup scored 4.477, the top lineups were:
 RUNS  ----- LINEUP ----
 4.488  5 2 4 3 1 6 7 8 9
 4.488  5 2 4 3 1 7 6 8 9
 4.487  5 2 4 3 1 6 8 7 9
 4.486  1 2 4 3 5 7 6 8 9
 4.486  5 1 4 3 6 2 7 8 9
 4.485  1 2 4 3 5 6 7 8 9
 4.485  1 2 4 3 5 6 8 7 9
 4.485  5 1 4 3 2 7 6 8 9
 4.485  5 1 4 3 6 2 8 7 9
 4.485  5 1 4 3 6 7 2 8 9
Ruane then sums up what he found as follows:
"I must confess that this wasn't what I hoped to find when I began this investigation. I suppose the best-case scenario would have been to find a handful of counter-intuitive lineups that were significantly better than the traditional ones. As it was, the best lineup in the NL scored only 4.4% more runs than the worst, and in the AL the range was even narrower, as the best team scored only 2.4% more runs than the worst. And the difference between the best and the traditional lineup is negligible: in the NL it amounted to 0.38% more runs (or about 3 runs a season) and in the AL it was 0.24% more runs. These results seem to agree with the long-held belief that the ordering makes little difference."
This result concords pretty well with a quick and dirty estimate I did last year. In my study using runs created per plate appearance and factoring in the number of plate appearances the NL optimal lineup scored 0.16% more runs than the traditional lineup and the AL 0.23% more. The optimal lineup in the NL scored 3.07% more runs than the least optimal lineup and in the AL the difference between the best and worst was 1.51%. Either way you look at it lineup construction makes little difference. Further, as Ruane mentions, the cost of making radical changes to the lineup such as batting Barry Bonds first from angry players and bewildered fans would likely offset any gains you might see.
But alas, try as I might to force my reason to overcome my emotions, I still sense a viceral reaction welling up within me when I see Neifi the Terrible and in the on deck circle in the bottom of the first. I'll work on it.
Thursday, July 14, 2005
The Draft 1996-2002
Below you'll find the raw data I used in my article on The Hardball Times that discussed the new book Scout's Honor by Bill Shanks.
                        Round 1                 Round 2         TOTAL
                             HS COLLEGE      HS      HS COLLEGE      HS COLLEGE      HS   TOTAL
    1996Overall TOTAL         22      13     63%      19      11      41      24     63%      65
                MLB           13      10     57%       8       4      21      14     60%      35
                             59%     77%             42%     36%     51%     58%             54%
        PitchersTOTAL         15       8     65%       9       6      24      14     63%      38
                MLB            9       8     53%       3       2      12      10     55%      22
                             60%    100%             33%     33%     50%     71%             58%
        Hitters TOTAL          7       5     58%      10       5      17      10     63%      27
                MLB            4       2     67%       5       2       9       4     69%      13
                             57%     40%             50%     40%     53%     40%             48%

    1997Overall TOTAL         27      25     52%      22      10      49      35     58%      84
                MLB           11      17     39%      12       6      23      23     50%      46
                             41%     68%             55%     60%     47%     66%             55%
        PitchersTOTAL         13      12     52%      13       6      26      18     59%      44
                MLB            2      10     17%       6       6       8      16     33%      24
                             15%     83%             46%    100%     31%     89%             55%
        Hitters TOTAL         14      13     52%       9       4      23      17     58%      40
                MLB            9       7     56%       6       0      15       7     68%      22
                             64%     54%             67%      0%     65%     41%             55%

    1998Overall TOTAL         20      23     47%      16      14      36      37     49%      73
                MLB            9      18     33%       6       7      15      25     38%      40
                             45%     78%             38%     50%     42%     68%             55%
        PitchersTOTAL          9      11     45%      11       6      20      17     54%      37
                MLB            6       8     43%       4       4      10      12     45%      22
                             67%     73%             36%     67%     50%     71%             59%
        Hitters TOTAL         11      12     48%       5       8      16      20     44%      36
                MLB            3      10     23%       2       3       5      13     28%      18
                             27%     83%             40%     38%     31%     65%             50%

    1999Overall TOTAL         25      26     49%      18      15      43      41     51%      84
                MLB            4      14     22%       3       7       7      21     25%      28
                             16%     54%             17%     47%     16%     51%             33%
        PitchersTOTAL         14      22     39%       5      10      19      32     37%      51
                MLB            4      11     27%       0       4       4      15     21%      19
                             29%     50%              0%     40%     21%     47%             37%
        Hitters TOTAL         11       4     73%      13       5      24       9     73%      33
                MLB            0       3      0%       3       3       3       6     33%       9
                              0%     75%             23%     60%     13%     67%             27%

    2000Overall TOTAL         25      15     63%      15      15      40      30     57%      70
                MLB            4       8     33%       2       9       6      17     26%      23
                             16%     53%             13%     60%     15%     57%             33%
        PitchersTOTAL         13      10     57%      10       6      23      16     59%      39
                MLB            1       6               1       4       2      10     17%      12
                              8%     60%             10%     67%      9%     63%             31%
        Hitters TOTAL         12       5     71%       5       9      17      14     55%      31
                MLB            3       2     60%       1       5       4       7     36%      11
                             25%     40%             20%     56%     24%     50%             35%

    2001Overall TOTAL         18      26     41%      17      14      35      40     47%      75
                MLB            4      11     27%       2       6       6      17     26%      23
                             22%     42%             12%     43%     17%     43%             31%
        PitchersTOTAL          8      13     38%      10       9      18      22     45%      40
                MLB            2       5     29%       1       5       3      10     23%      13
                             25%     38%             10%     56%     17%     45%             33%
        Hitters TOTAL         10      13     43%       7       5      17      18     49%      35
                MLB            2       6     25%       1       1       3       7     30%      10
                             20%     46%             14%     20%     18%     39%             29%

    2002Overall TOTAL         18      23     44%      20      10      38      33     54%      71
                MLB            3       7     30%       0       4       3      11     21%      14
                             17%     30%              0%     40%      8%     33%             20%
        PitchersTOTAL          7      14     33%       9       4      16      18     47%      34
                MLB            2       4     33%       0       2       2       6     25%       8
                             29%     29%              0%     50%     13%     33%             24%
        Hitters TOTAL         11       9     55%      11       6      22      15     59%      37
                MLB            1       3     25%       0       2       1       5     17%       6
                              9%     33%              0%     33%      5%     33%             16%

        Overall TOTAL        155     151     51%     127      89     282     240     54%     522
                MLB           48      85     36%      33      43      81     128     39%     209
                             31%     56%             26%     48%     29%     53%             40%
        PitchersTOTAL         76      61     55%      60      42     136     103     57%     239
                MLB           22      33     40%      18      16      40      49     45%      89
                             29%     54%             30%     38%     29%     48%             37%
        Hitters TOTAL         79      90     47%      67      47     146     137     52%     283
                MLB           26      52     33%      15      27      41      79     34%     120
                             33%     58%             22%     57%     28%     58%             42%
Wednesday, July 13, 2005
No XBox
Was alerted by CubsNet.com that the XBox promotion in the Northern League I blogged about a couple weeks ago has been cancelled. The commissioner of the leage said:
"However, after further review and discussion, I have decided that this concept as originally presented is not in the best interest of the Northern League. Any promotion that could affect the outcome of a regular season game is not permissible. Ultimately, such an event could have an influence on the final standings, and this certainly challenges the integrity of the league."
I for one thought it was a good idea if the two XBox players were well matched. If not, as one commenter on CubsNet said, you could have a 57-0 game that lasts a couple hours like when I play my nephew.
Tuesday, July 12, 2005
The Curious Case of Zack Greinke
As I sit here and watch the AL beat up on the NL in the All-Star game (for the 8th straight time) I can't help remembering the high hopes we Royals fans had for Zack Greinke this season. Even though I wasn't as optimistic as some because of what I called Greinke's "old pitcher skills" (which are a good thing), there is no way I would have forseen the collapse which ended with 20 hits and 10 earned runs in his last 10 and two-thirds innings pitched.
For the season he has a 6.20 ERA and given up 126 hits in 97.1 innings, walking 26 and striking out 58 while giving up 11 homeruns and sporting a 1-11 record. As you can imagine when compared with last season his walks per inning pitched are up from 1.6/9 IP to 2.4/9 IP, his strikeouts are down (6.2 to 5.4), his strikeout to walk ratio is down (3.85 to 2.23) but his homerun rate is also down moving from 1.6/9 IP to 1.0/9 IP. I'm also encourage that his ground ball to fly ball ratio has increased from 0.81 in 2004 to 1.05 this season. Although his walks have increased and his strikeouts have decreased he still has very respectable ratios of both and when combined with his low homerun rate and increasing ground to fly ratio it kind of makes you wonder how he could have given up so many hits.
A quick look at The Hardball Times stat pages provides three clues to the answer. First, Greinke's line drive percentage is 21.7%. That places him third behind only Bruce Chen (24.5%) and John Lackey (23.7%) in the AL. Line drives become hits 75% of the time whereas groundballs are converted into outs 75% of the time. If Greinke had given up the league average of 18% line drives he would have given up 9 or 10 fewer hits which may translate into a handful of earned runs saved. Last season he gave up just 16% line drives. One of the cautions about Greinke I mentioned previously was that he doesn't have an "out" pitch and so his ability to locate his pitches and change speeds become even more important. If his location starts to suffer it follows that he'll get hit harder as evidenced by an increasing line drive percentage.
Secondly, the Defensive Efficiency Rating (DER) behind Greinke this season is just .667. In other words the Royals defense converts balls put into play into outs when Greinke is on the mound 66.7% of the time with the league average being around 69%. Tops in the AL is Jose Contreras of the White Sox who has as DER of .764. Certainly, some of that difference is the fact that Greinke has given up more line drives but not all. The Royals defense has played a role. And that leads us to the most important clue and that is Greinke's FIP. FIP stands for Fielding Independent Pitching and is an attempt to measure those things for which a pitcher is responsible for and estimate what his ERA "should" be all other things being equal. FIP is calculated as:
FIP = (HR*13+(BB+HBP)*3-K*2)/IP
plus a league-specific factor usually around 3.2. Greinke's FIP is 4.47 which is a difference of -1.73 from his actual ERA. Only Jose Lima has a bigger difference. So why is the difference so large? You'll notice that hits aren't included in the calculation of FIP since things like walks, strikeouts, and homeruns are a better predictor of pitching performance than hits given up since there is more variability in whether a batted ball is converted into an out or not. And in 2005 Greinke's batting average on balls in play is near .340. Some of this is due to his high line drive percentage, some to poor defense, and some to plain bad luck.
So in short, Greinke's performance in 2005 has been disappointing but not quite as disappointing as a 6.20 ERA might indicate. I'd look for some improvement in second half.
Monday, July 11, 2005
All-Star Quotes
With the All-Star game being played in Detroit tomorrow night I thought this quote by Sparkey Anderson about Willie Stargell on the eve of the 1971 game played in Detroit was appropriate.
"He's such a big, strong guy he should love that porch. He's got power enough to hit home runs in any park, including Yellowstone."
Of course this year's game won't be played at the old Tiger Stadium. Comerica Park can be friendly to left handers when you hit it down the line (330') and in the alley (365') but is bigger in left where the line is at 345' and the alley at 370'. Originally the power alley in left-center was 395' but they moved it in 2003. Center field is at 420'. I would look for a left-hander to win the homerun contest tonight. My money is on David Ortiz.
Here are a couple other of my favorite all-star quotes:
"Arch (Ward) called me one day and asked me to have dinner with him. I didn't know he had anything in mind other than a sociable dinner until he sprang the All-Star Game idea on me, and I was flabbergasted at first. The idea was sound enough since that was the first year of the World's Fair in Chicago and Arch wanted to make an All-Star Game one of the highlights. His sales pitch was that it would be a wonderful thing for baseball. I told Arch I would submit the proposition to the owners. The American League owners finally agreed after considerable discussion that it would join strictly as an attraction for the 1933 Fair. At first the National League opposed it, but finally agreed to play the game for only one year. The game turned out to be so wonderful and so well accepted by the fans that the owners quickly agreed to continue the game and it became a solid fixture." - Will Harridge in Professional Baseball: The First 100 Years (1976)
"If I ain't startin', I am departin'." - Garry Templeton (1981 All-Star Game)
"They invented the All-Star Game for Willie Mays." - Ted Williams
Saturday, July 09, 2005
Pitcher's Duel at Coors
And who says fans don't like pitcher's duels? Tonight I scored the Rockies 1-0 victory over the Padres at Coors Field. It was the first 1-0 game here and the 847th played in the regular season (there were also two post season games played in 1995 and neither went 1-0). That is a record as you can imagine. The next longest streak of non 1-0 games belongs to the Philadelphia A's of the American Association who went 635 games between 1882 and 1891.
Jason Jennings got the win and pitched 7 innings. He was in and out of trouble all night but was helped by three double plays. He threw 110 pitches but only 63 were strikes. For the Padres Brian Lawrence was impressive. In 7 and one third innings he threw just 74 pitches, 49 for strikes and was keeping the Rockies off balance with his three quarters delivery and variety of breaking balls. Each pitcher only struck out one batter in the game.
The Rockies got their run in the 6th when Aaron Miles bunted for a single with one out (incidentally Miles was hitting leadoff with his 2 walks in 179 plate appearances). Luis Gonzales then doubled to the 420 foot mark in left-center as Miles came all the way around to score.
There was an interesting managerial decision however. With the 1-0 lead Rockies manager Clint Hurdle brought in right-hander Jay Witasik to pitch the 8th when the Padres were due to send Brian Giles, Ryan Kleso, and Mark Sweeney, all lefties, to the plate. Although Witasik has pitched well the logical choice in that situation to me would have been left-hander Brian Fuentes. But I assume that since Fuentes has been tagged as the "closer" Hurdle felt uncomfortable bringing him in an inning other than the 9th. If so, that's really dumb. Clearly, the numbers 3, 4, and 5 hitters coming up in the top of the 8th inning was the highest leverage situation of the game. Why not use your best pitcher, especially if he has a massive platoon advantage? Fuentes had a .190 SLUG and .271 OBP against lefties. Hurdle's discomfort may be related to the fact that if he does bring in Fuentes and he fails in the 8th, he'll get second guessed by most of the media. If he leaves him for the ninth and Witasik blows it nobody will say a word (except me). By the way, if you're interested in relief usage patterns and leveraged situations (aren't we all?) in the era of the closer you should check out The Hardball Times Bullpen Book. Fascinating stuff.
As it turned out Witasik walked the leadoff hitter but then retired the next three in the 8th. Fuentes had some trouble in the 9th as he walked the first two batters before striking out the next two. Gonzales then booted a slowly hit ball by Eric Young to load the bases. Then on a 2-2 count he struck out Brian Giles on a foul tip. The 30,228 fans were rocking the ballpark in the 9th and (almost) everybody went home happy. A great day at the ballpark.
Schuerholz Interview
Baseball Prospectus Radio had a nice interview with Braves GM John Schuerholz this morning posted on their web site. Anyone who has read Scout's Honor will be interested in what he had to say with regards to draft strategy and payroll.
Interestingly, the Braves chose a college pitcher this year in the first round with the 27th pick (35 of their 52 picks were pitchers and only 19 of the 52 were college players, just five from division I schools), something that they wouldn't typically do. Their pick was right-hander Joe Devine out of North Carolina State who was promoted to AA Mississippi a few days ago. Shuerholz mentioned that he is definitely in the plans for next season in the closer role. Of course, one of the advantage of drafting college players is the potential for a quick return on the investment at the major league level. It seems that more and more teams might be adopting this strategy with relief pitchers especially although when asked about it Schuerholz denied that they had in any substantial way changed their overall approach to the draft. Very interesting stuff.
Thursday, July 07, 2005
Extreme Environments
My article on winning in extremem parks has been published on The Hardball Times
Wednesday, July 06, 2005
Racial Quotas?
This week there's been an interesting discussion on the SABR-L list as to whether there was ever an unspoken racial quota system in place in the Major Leagues. The thread originated in some comments made by Frank Robinson (I think) to the effect that teams only had one black star and his roommate in the early days. While that may have been true as each team signed its first black players these stats posted by Julius Tygiel don't support the idea that a quota was in place.
The percentage of blacks rose steadily starting in 1949 and plateaued in 1975 at 20.02%. The percentage of whites reached around 72% in the early 70s as well. Both levels have fallen since as Latinos and more recently Asian players have become more prevalent. Latinos passed blacks in 1997. Today's composition as of 2002:
White: 61.8%
Black: 11.4%
Latino: 24.7%
Asian: 2.6%
Sky Sox Action
Had a chance last night to get out and see the Colorado Springs Sky Sox (Rockies AAA club) play the Sacramento River Cats (Oakland's AAA) on $2 Tuesday where all sets were just $2 (I sat right behind the plate in the first row). It was unusual game for Security Service Field as the River Cats won 3-1. The only offense for the Sox was the solo homerun by Ryan Shealy (his 14th) in the 6th inning. He hit it to the opposite field and it cleared the 386 foot sign in right-center on a high arc. Shealy was called up during interleague play and went 6-20 with a homerun, double, and three walks. His patience still seems to be an issue as he's walked now just 17 times in 267 plate appearances.
For the Sky Sox Jose Acevedo (still rehabbing) got the start and was not very effective giving up four hits in his two innings of work. His fastball clocked in from 87-91 and he also threw a curveball in the mid 70s and what looked like a slider that came in around 81. His mound opponent, 28 year-old Seth Etherton was outstanding. He's coming back from a torn labrum a few years ago and pitched in the Reds organization last season where he threw well for Louisville. In his 7 innings he gave up just 4 hits including the homeun to Shealy. His fastball topped out at 89 but he was very effective with his breaking stuff and hit all his spots. His ERA is now 2.29 and could be helpful for the A's in the second half as a spot starter or long reliever.
On the offensive side I got a chance to see Charles Thomas for the River Cats who was acquired in the Tim Hudson deal with the Braves and who has a chapter devoted to him in the new book Scout's Honor (and which I'll be reviewing soon). He hit .109 for the A's and so now he's back in AAA where he's hitting .287/.426/.378 and leading off. He could possibly be a decent fourth outfielder since he plays pretty good defense (he was in CF last night). The River Cats also have Jack Cust, who had a cup of coffee with the Rockies in 2002 and again with the Orioles in 2003. He has tremendous plate discipline and walked twice. He now has walked 68 times in 372 plate appearances to go with 13 homeruns and...get ready...95 strikeouts. He's almost a three true outcomes guy - really two true outcomes I guess. It would be interesting to see what he could do at the major league level. His AAA line is .283/.480/.415. The River Cats also have an interesting fourth outfielder kind of guy in Matt Watson (.313/.510/.399) who has seen a little action in Oakland this season. He was a 16th round draft pick in 1999 by the Expos and is now 26.
And as expected the River Cats are leading the league in walks while the Sox are dead last.
Retrosheet Studies
There were a couple of great studies updated on the Retrosheet web site by Tom Ruane recently. The first deals with clutch hitting since that's been a topic of some interest recently. I like this study because it uses much larger sample sizes than the original clutch hitting studies that simply look at year to year differentials.
Tom presents a mountain of data from 1960-2004 in a very understandable format. I was particularly interested in his data that shows that hitters do indeed perform more pooly with runners in scoring position than they do in other situations once sacrifice flies, hit batsmen, and walks are taken into account. He also breaks the data down into hitters who had above and below 3000 clutch at bats.
 1-2999        AB       H     2B    3B     HR  BAVG   SLG   BPS
Not RISP  1748765  414965  70688  9459  35513  .237  .349  .587
RISP       588724  135614  23479  3614  10466  .230  .336  .566

 >=3000        AB       H     2B    3B     HR  BAVG   SLG   BPS
Not RISP  2848124  773189 135086 19045  84334  .271  .421  .693
RISP       974948  257380  45517  7173  26300  .264  .406  .670
There are two impliciations here. First, you would expect that hitters with more clutch at bats would have a smaller differential between non-clutch and clutch performance on the theory that these hitters were "selected" for more at bats in part because of their ability to perform when needed, but this was not the case. They were better hitters of course but saw the same dropoff in clutch situations. Seconodly, this does provide support for the notion that if clutch hitting exists the defintion of a clutch hitter is more a hitter whose performance does not decline in key situations but rather remains the same or slightly improves.
Digging into this second point Tom also explores some plausible theories as to why performance might fall off in these situations including the ability for the defense to record force outs, the spike that occurs when a runners is on first due to the first baseman holding the runner, the fact that better hitters are walked more often with a runner on second or second and third, platoon advantages, quality of pitching, and even park factors. He found that platoon advantage for the hitter and higher quality of pitching tend to balance each other out in the long haul. In looking at his data I found that when excluding the at bats with a runner on first only the difference shrinks to around 11 points of BPS (batting average + slugging percentage), roughly half of the raw difference. As a result it would appear that hitters do tend to hit more poorly in clutch situations overall.
In conclusion Tom reports:
"So did I find evidence of clutch hitting? Not really. I did come up with lists of players who performed well and poorly in this area. Along the way, I presented quite a bit of data on situational hitting, platoon advantages, opposition pitching strength and park effects, and I attempted to both understand and explain what I found. At the end of all this, however, I guess I'm still not convinced that the players owe their inclusion on these lists of mine to talent rather than luck. Even when dealing with sample sizes of several thousand at-bats, the amount of random variation that I found in my simulations was very close to what I found in the real data. As I mentioned before, this doesn't necessarily mean that there isn't some real differences buried in all that noise, only that I'm not sure I found them. One could argue that the forces at work here, if they exist, must be awfully weak to so closely mimic random noise, and if they are really that inconsequential perhaps we could assume they don't exist without much loss of accuracy."
To me this tends to confirm what most sabermetricians have been saying since 1978 - clutch hitting may be a real skill but if it is it makes very little difference in the long run.
The second study is an update to an approach discussed in the 1987 Baseball Abstract. Tom applies a slightly different methodology and also includes positional adjustments and stolen base runs. He compares his method with a more straightforward linear weights method and even applies the method to pitchers. Very interesting reading.
Monday, July 04, 2005
James Part III
Here is part III of Baseball Digest Daily's interview with Bill James. In this installment James says in reference to the previous installment regarding bunting:
"To me, the arguments against the sacrifice bunt are unconvincing. Base stealing helps you at a 75% success rate, hurts you at 55%, so the attempt very often IS worth it. What DOESN’T pay often is putting a player in the lineup because he can steal bases. A player who steals 65 bases and is caught 10, 15 times...sure, that helps you. But if you put Dave Collins in the lineup rather than Oscar Gamble because Dave Collins can steal bases, then that hurts you."
And this I think is closer to the heart of the message of Moneyball and Weaver's 10 laws than simply saying you're never going to sacrifice or steal bases. When Chuck Tanner installed Omar Moreno in the leadoff spot for the Braves in 1986, he did so apparently thinking that speed in the leadoff spot by itself somehow generated runs. More specifically, he probably concluded intuitively that Moreno's speed compensated for his failure to get on base by allowing him to put himself in scoring position more often. It did not and does not because of the opportunity cost of those additional outs that Moreno consumed. Speed is a strategic weapon you can use once you reach base. It seems obvious now but it wasn't ten to twenty years ago.
James also makes some interesting comments about the recent draft and his participation for the Red Sox. Great stuff and thanks to Joe Hamrahi for sharing the interview.
Brenly a Moneyballer?
In yesterday's 5-4 12-inning loss to the Nationals yesterday I heard Cubs broadcaster Bob Brenly actually say something very interesting and very true.
He mentioned that in doing some quick math he realized that if Jerry Hairston (.360)and Todd Walker (.350) were to bat first and second instead of Corey Patterson (.274) and Neifi Perez (.296), Derrek Lee and company would have 85 to 100 more opportunities in a season with runners on base. In redoing his calculations he apparently based it on 600 plate appearances where it would yield 84 more times on base for Hairston and Walker. When you subtract homeruns that's around 70 or so but Brenly was on the right track. I also heard him over the weekend say that at least at the team level hitting well in "clutch" situations was largely luck and that it would even out over time. Is Bob a closet Moneyballer?
Today I see that Hairston is leading off against the Braves with Walker batting second.
Beyond the Box Score
I've started to post some thoughts on Beyond the Box Score. Today's topic, appropriate for July 4th is the Washington Nationals and their confounding of Pythagoras.
Sickels on the Royals
I thought Royals fans who read this blog would be interested in John Sickels Royals Top 20 in Review article from his blog.
Interesting that Sickels comments for J.P. Howell, Ambiroix Burgos, Shane Costa, and Leo Nunez all include something to the effect that they were rushed to the majors, echoing my comments of yesterday (or I guess I echoed him since he published first). I was hoping that Chirs Lubanski, the Royals number one pick (5th overall) from 2003 would be higher than 17th and have a more encouraging outlook than:
"Pulling out of early season slump. Now hitting .259/.307/.511 with 17 homers. Power improving, though some of that is due to environment, and plate discipline and contact are still major questions."
Saturday, July 02, 2005
Hate to say I told you so...
Just thought I'd check in on how the Royals have been doing since they hired Buddy Bell as manager. Right out of the shoot the Royals swept the Yankees, went 1-2 with the Rangers, 2-1 against the Giants, 2-1 against Arizona, and swept the Dodgers. That put them at 10-4.
Since then they've dropped two of three to the Astros, been swept by the White Sox, swept by the Rockies, dropped two of three to the Twins, and lost the first of a three game set to the Angels. So that makes it 2-11 since June 17th for an overall mark of 12-15 and now 26-52 for the season.
Buddy may be a teacher but he's not a miracle worker.
As a Royals fan I'm not so disappointed that the Royals stink since that was a foregone conclusion since I saw them in Spring Training. I'm most disappointed that they've somewhat recklessly brought guys up to the majors who have no reason to be there including Burgos (21 yrs old), Nunez (21 yrs old), Howell (21 yrs old), Huber (23 yrs old), and Costa (23 yrs old). These guys might form a good nucleus in Omaha, especially when you team them with Denny Bautista (24 yrs old) and Ruben Gotay (22 yrs old) but all of these guys now have major league service time and other than Gotay are not getting at bats on a regular basis. What would be the harm in letting these guys mature as a group in Omaha and then bringing them up together next season in a true youth movement that includes Greinke, Teahen, and DeJesus? As it is the Royals have a mix of young guys with a few veterans like Terrance Long, Matt Stairs, and Emil Brown. Can you really justify giving at bats to these guys over developing Huber and Costa? I sense some grasping at straws to try and salvage something from this season at the major league level. I say, be patient and bigger dividends will be paid down the road.
Friday, July 01, 2005
Getting Rid of Batting Average
Kansas City Star columnist Joe Posnanski had a column in Thursday's paper called "Believe it: It’s time to retire batting average". Since the column requires registration I'll report that he, with the help of Bill James, makes a humerous case for why batting average is so misleading by comparing it to rating a novel by the number of words per page and rating doctors by the number of patients they see per day among others.
He also uses the much more serious example of Ken Harvey, a guy whose entire value is tied up in his batting average and the contra-example of Jimmy Wynn to illustrate that batting average does not tell much of the story. He goes on to say,
"There are a lot of players like Wynn who never were appreciated enough because of relatively low batting averages — Bobby Grich, John Mayberry, Bob Allison, Darrell Evans, Boog Powell, Toby Harrah and Roy White, to name a few. They got on base. They hit for power. Those things matter. Batting average doesn’t.
It’s time. I’m not sure which statistic we should use in its place. The trendy statistic now is OPS — on-base percentage plus slugging percentage — but that has its own flaws. There is “secondary average,” which takes into account total bases, walks, stolen bases. There is plain old on-base percentage, which I like. There are plenty of options."
I have seen OPS appear in a television broadcast, I just can't remember where. As a single number I'd prefer it because of its simplicity, comparative ability, and correlative value. It does a much better job of conveying the run producing ability of a player than any of its three component parts (AVG, SLUG, and OBP) do and could be used effectively in shorthand venues such as television screens. That said, I'd rather see more stats on the top and bottom portions of the screen instead of out of town scores and miscellaneous sports news. Then we could see the standard AVG/OBP/SLUG format that conveys even more information than OPS.
The Fog is Lifting
The February 2005 issue of By The Numbers, the newsletter of the SABR statistical analysis committee has been published (for those readers who are not members of The Society for American Baseball Research, click here to join).
Of particular interest were articles by Jim Albert and Phil Birnbaum, both of which relate to Bill James' article in the 2005 Baseball Research Journal titled "Underestimating the Fog".
The Fog Reviewed
I wrote a short review of James' article back in March and at that time noted that:
"James' argues that some of the best known negative sabermetric conclusions should not really be viewed as conclusions at all, but rather simply as non-answers to questions under study.
James goes on to criticize the common technique employed in various sabermetric studies that typically cited to 'prove' these conclusions - for example Dick Cramer's famous 1977 Baseball Research Journal article on clutch hitting and James' own look at platoon differentials in the 1988 Baseball Abstract. That technique involves the search for recurrence or persistence of the phenomena being studied. In other words...studies were done that attempted to determine if the effect...persisted across seasons. In each case repeated studies have shown that it doesn't - therefore the effect is, in the words of James, 'transient' and not 'persistent'. That which is not persistent is then assumed not to be real.
James then argues that in many of these cases the negative conclusion - the phenomena is not real - is flawed because there is too much instability in the data used to make the conclusion...The randomness involved in such a small sample size tends to swamp the differential itself, thereby making the results meaningless. James notes that Cramer's original study of clutch hitting was flawed for the same reason."
Albert's Comments
In his article, titled "Comments on 'Underestimating the Fog'", Albert brings a bit more clarity to what James was saying and talks specifically about the amount of luck and the amount of ability in various baseball statistics (a topic that he and co-author Jay Bennett discussed in their excellent book Curve Ball). He notes that given a set of players with 500 at bats, about 50% of the variation in batting average will be due to luck while the other 50% can be attributed to differences in their hitting ability. He then notes, as does James, that the amount of luck will vary with sample size. He has also discussed this topic in another online article that I referred to in in a post on the general topic of luck and batting average a few months back as well.
Albert goes on, however, to disagree with James in his assertion that using comparison offshoots (difference between two statistics) in making comparisons between players has the effect of summing the luck component of the individual statistics. He says this notion is simply "nonsense" and uses a simple example to show why. Albert then illustrates his methodology of testing against a simple model and concludes that there is evidence for a platoon difference (using SO/AB) as he and Bennett concluded in chapter 4 of Curve Ball. Platoon differences are one of the sabermetric conclusions that James called into question in his original article.
In conclusion Albert notes that what James is simply a restatement of the logic statisticians use when they test models meant to approximate reality.
"When we assess the goodness of fit of a model, there are two possible conclusions: either there is significant evidence to reject the model or there is insufficient evidence. Saying there is not enough evidence to reject the model doesn’t say the model is true, but it does say that we just can’t provide evidence to say that it is false. Statisticians don’t prove models are true – that’s why we are careful to say things like "we have insufficient evidence to reject a model.'"
His opinion, then, is that phenomena like those mentioned by James including clutch hitting may indeed exist, but it is likely they have a very small effect and are difficult to pick up with a statistical test.
Birnbaum's Regressions
The more controversial of the two articles in By The Numbers is Phil Birnbaum's "Clutch Hitting and the Cramer Test". In this article Birnbaum attacks James' notion that "random data proves nothing - and it cannot be used as proof of nothingness" and says it is "certainly false". His position is that if one can show that their study is well designed, then a conclusion of "no effect" can reasonably be offerred.
Birnbaum goes on to apply the method used in Cramer's 1977 article to data from 14 pairs of seasons from 1974 through 1990 and shows the correlations in the table reproduced here.
         r     r^2   f
74-75  .0155 .0002 .86
75-76  .0740 .0055 .37
76-77  .0712 .0051 .40
77-78  .0629 .0040 .44
78-79 -.1840 .0339 .02
79-80  .0038 .0000 .96
82-83 -.0250 .0006 .75
83-84  .0456 .0021 .60
84-85  .0222 .0005 .79
85-86  .0728 .0053 .38
86-87  .0189 .0004 .82
87-88  .0034 .0000 .97
88-89  .0829 .0069 .33
89-90  .0373 .0014 .67
He then creates a model where clutch hitting exists and compares the model's results with the actual results. His conclusion is that while the Cramer test can easily determine whether clutch hitting is a real phenomenon if the ability were normally distributed with a standard deviation of 30 points, the method starts to fail once the standard deviation falls below about 7.5 points. In other words, he is in agreement with Albert that if clutch hitting is real, its effect is small.
He then combines the data for his 14 seasons into a single regression and concludes that the Cramer test could pick up the effect at a standard deviation of 15 points but begins to fail at a standard deviation of about 10 points.
In his set of conclusions Birnbaum acknowledges that the Cramer test cannot completely disprove the existence of clutch hitting, but it does put a "strong lower bound on the magnitude of the possible effect". That lower bound is that the effect is certainly less than 15 points of batting average; "that is, at least two-thirds of all players are expected to clutch hit within .015 of their non-clutch batting average." And so his conclusion is that given the small effect it is probably impossible to distinguish good clutch hitters from bad.
Two Responses
These article then generated a response from Bill James called "Mapping the Fog" which he posted to the SABR Statistical Analysis Committee Yahoo group. That was quickly followed up by a response from Phil Birnbaum published in the same forum. Both responses have now been published along with a lively discussion by Chris Dial on The Baseball Think Factory.
In the meat of his response James creates a model where clutch hitting exists (a model league where 20% of the hitters are clutch performers at the level of 25 points) and then uses the Cramer test to try and detect the effect. The test does not reliably detect it (it would do so only 65% of the time) and so he concludes that even under these ideal circumstances the Cramer test has nothing to say as to whether clutch hitting is a real phenomena or not.
"Even when we know that the clutch effect does exist within the data, even when we give that effect an unreasonably clear chance to manifest itself, there is still a 35% chance that it will entirely disappear under this type of scrutiny."
James goes on to respond specifically to statements made in both articles and notes that in his opinion "there is an immense amount of work to be done before we really begin to understand this issue."
In his response Birnbaum response is critical of the way James applied the Cramer test to his model, using a simpler sign based test rather than an actual regression. He goes farther, however, and actually uses James' model with the regression analysis and concludes that using 14 separate seasons of data the Cramer test works in that it would pick up clutch hitting using James' model.
My Response
I find this entire discussion important and fascinating since it comes so close to the heart of how many sabermetric studies have been done - the most recent and famous being the conclusions drawn in favor of DIPS.
For the most part I have to side with Albert and Birnbaum and agree that while these statistical tests can never prove that clutch hitting or platoon differentials do not exist, using data over a number of seasons (after all, the number of true clutch plate appearances is small, around 50 per 600) or for an entire career they can surely indicate that if they exist, their effects are small and may even fall within the normal variation of the statistics that are used to measure them. As a result - and here is the actionable thing - they needn't be considered when making personnel decisions over the long haul.
As an aside I thought the most interesting comment made in the discussion of this topic on TBTF was that it could be the case that clutch hitting is actually a "negative ability". In other words, it could be the case that most hitters actually perform worse in clutch situations and that good clutch hitters can be defined as those who maintain their performance level. It would be interesting to see what a model would look like to test for this.
Subscribe to:
Posts (Atom)
125x125_10off+copy.jpg)


