FREE hit counter and Internet traffic statistics from freestats.com

Saturday, July 29, 2006

Valuing Outs

Scoring my first of four consecutive games tonight at Coors Field as the Rockies take on the Padres. For the Rockies this is an extremely important series and they've responded by winning the first two games; on Thursday night with a 6 run comeback to win 9-8 and last night winning 3-1 on some fine pitching by Byung-Hyun Kim. Coming into tonight they were just 4.5 games in back of the Padres.

Tonight they lost 4-2. A costly error by Garrett Atkins led to 2 runs for the Padres in the top of the 5th that ended up being the difference.

But what interested me thus far was the situation that occurred in the bottom of the third inning. After Jeff Francis grounded out to third, Jamey Carroll slapped a single to right. With Clint Barmes up he stole second base despite a nice throw by Mike Piazza. So at this point Carroll is on second with one out. Early in the at bat Barmes actually acted as if he were going to bunt but continued to foul off pitches to work the count to 2 and 2. At this point he hits a lazy fly ball that Mike Cameron in center drifts under. Carroll tags at second and makes it easily to third. What surprised me was the reaction of the crowd of more than 43,000 to this sequence of events. They erupted in applause almost as if Barmes had driven in the run.

There are two possible explanations for this. The first is that perhaps the expectations for a Barmes at bat are so low that any perceived positive outcome is treated as a victory. I myself am of that persuasion. However, I'm inclined to think that the real reason is a fundamental misunderstanding regarding probability and the importance of outs. With one out and a man on second the run expectancy over the last six years, as shown in the following table, has been .704 runs.


Base/Out 0 1 2
xxx 0.530 0.287 0.112
1xx 0.921 0.552 0.242
x2x 1.160 0.704 0.335
xx3 1.441 0.978 0.371
12x 1.523 0.935 0.445
1x3 1.844 1.214 0.510
x23 2.030 1.430 0.599
123 2.364 1.579 0.789

In other words, all other things being equal a team will score on average about seven tenths of a run in the remainder of the inning when you reach this base/out state. After Barmes flied out to center the run expectancy dropped almost in half to .371. In other words, the Rockies situation had deteriorated markedly and yet the crowd reacted as if something good had happened. Of course what they were reacting to was the fact a runner had advanced 90 feet and was therefore physically closer to home plate.

That perspective is flawed however since in reality Carroll (and subsequent hitters) were more likely to score while he was standing on second a few moments prior. The reason is that the number of outs, the quantity of which is in limited supply and therefore what actually controls the game, is all important in baseball. Fundamentally, sacrificing a base (other than home) for an out always decreases run potential. There are situations where doing so increases the probability of scoring a single run but those are few and far between and generally occur only with the weakest of hitters (pitchers) at the plate. In any case, this early in the game it is always a better bet to try and maximize run potential rather than playing for the single run, a lesson that Rockies manager Clint Hurdle should take to heart.

So this is a case where our eyes deceive us. Carroll standing on third with two outs is not better than him standing on second with one out. The structure of the game makes this the case.

Of course the fans also engaged in a spirited round of "the wave" in the 8th inning during a crucial situation with Padre runners on board.

Thursday, July 27, 2006

Introducing EqAAR

This week my BP column centered around creating a metric for crediting baserunners for advancing on outs in the air (such as sacrifice flies). You'll have to read the article for the full methodology but it relies on the Run Expectancy matrix for 2000-2005 and the probabilities of advancement given a number of situational factors including base/out state, hit type, and fielder.

In any case here are ratings in this new metric called Equivalent Air Advancement Runs (EqAAR) for 2005 for those players with 25 or more opportunities. ExAAR is the expected number of runs given the opportunities and the context of those opportunities for the player. It should be noted that these do not take park factors into account which I think are probably pretty imporant for a metric like this.

You'll also notice that there really isn't much of a gain here, accounting for roughly a quarter of a win at both extremes. The reason for this, as I talk about in the column, is that advancing on outs just doesn't provide good baserunners with the opportunity to distance themselves from the crowd since even mediocre runners advance with great success, especially from third. I also wrote a bit about sacrifice flies in the spring over at THT and this is a continuation of sorts of that work but includes advancing from all bases.


Name Opps ExAAR EqAAR Rate
Chone Figgins 39 6.04 1.79 1.30
Marcus Giles 41 5.94 1.75 1.30
Johnny Damon 54 6.66 1.66 1.25
Ichiro Suzuki 38 4.42 1.49 1.34
Luis Gonzalez 32 5.26 1.44 1.27
Jimmy Rollins 38 5.68 1.42 1.25
Michael Young 32 2.33 1.35 1.58
Mike Young 32 2.33 1.35 1.58
Craig Monroe 27 3.33 1.35 1.40
Jose Reyes 33 4.64 1.34 1.29
Ronnie Belliard 32 2.15 1.28 1.60
Albert Pujols 27 1.90 1.25 1.66
Juan Uribe 30 4.70 1.23 1.26
Willy Taveras 35 4.14 1.12 1.27
Jerry Hairston 26 2.18 1.11 1.51
Carlos Delgado 36 5.14 1.08 1.21
Nick Johnson 28 2.80 1.08 1.39
Juan Encarnacion 26 3.43 1.07 1.31
Jason Kendall 55 3.05 1.07 1.35
Rob Mackowiak 26 3.06 1.06 1.35
Greg Zaun 26 3.22 1.04 1.32
Jason Bay 29 4.77 1.02 1.21
Miguel Cabrera 39 4.74 1.01 1.21
Ray Durham 32 3.56 0.97 1.27
Shea Hillenbrand 33 3.87 0.93 1.24
Ryan Freel 26 4.28 0.93 1.22
Kevin Mench 29 3.22 0.88 1.27
Chipper Jones 26 1.31 0.83 1.64
Kevin Millar 25 4.91 0.82 1.17
Royce Clayton 32 3.90 0.82 1.21
Placido Polanco 35 4.01 0.82 1.20
Derek Jeter 47 2.92 0.80 1.28
Hank Blalock 42 1.81 0.74 1.41
Bobby Abreu 39 2.29 0.73 1.32
Joe Randa 27 3.06 0.73 1.24
Mark Teixeira 27 2.98 0.72 1.24
Aaron Rowand 33 3.81 0.72 1.19
Jack Wilson 33 4.99 0.69 1.14
Nick Green 26 2.91 0.69 1.24
David Dellucci 25 1.52 0.65 1.43
Grady Sizemore 38 4.69 0.62 1.13
Jason Varitek 26 1.43 0.61 1.43
David DeJesus 36 4.85 0.60 1.12
David Eckstein 41 3.30 0.58 1.17
Nick Swisher 25 3.16 0.57 1.18
Luis Gonzalez 28 1.30 0.55 1.43
Matt Holliday 26 2.36 0.54 1.23
Cesar Izturis 25 4.01 0.52 1.13
Troy Glaus 30 2.43 0.49 1.20
Miguel Tejada 31 3.47 0.49 1.14
Hideki Matsui 36 6.61 0.49 1.07
Travis Hafner 36 3.55 0.43 1.12
Darin Erstad 39 3.83 0.41 1.11
Jeromy Burnitz 35 3.38 0.41 1.12
Eric Chavez 28 1.78 0.39 1.22
A.J. Pierzynski 25 1.48 0.38 1.26
Luis Matos 28 3.11 0.37 1.12
Manny Ramirez 30 4.36 0.35 1.08
Melvin Mora 36 5.57 0.35 1.06
Alex Rodriguez 32 1.80 0.32 1.18
Brian Roberts 35 1.84 0.26 1.14
Scott Podsednik 40 4.35 0.26 1.06
Terrence Long 25 2.12 0.25 1.12
Brandon Inge 32 2.30 0.19 1.08
Garrett Atkins 26 0.60 0.17 1.29
Randy Winn 31 2.84 0.17 1.06
Brady Clark 36 5.01 0.16 1.03
David Wright 30 3.36 0.13 1.04
Brad Wilkerson 26 4.26 0.09 1.02
Gary Sheffield 34 1.65 0.06 1.04
Mark Loretta 29 2.47 0.02 1.01
Adrian Beltre 29 0.58 -0.04 0.92
Juan Pierre 30 6.96 -0.07 0.99
Alfonso Soriano 45 2.76 -0.07 0.97
Craig Counsell 39 4.07 -0.09 0.98
Paul Konerko 25 1.57 -0.10 0.94
Trot Nixon 29 2.06 -0.15 0.93
Dave Roberts 36 3.14 -0.15 0.95
Neifi Perez 25 1.79 -0.15 0.91
Mike Lieberthal 29 1.54 -0.19 0.88
Mark Ellis 38 4.48 -0.20 0.96
Raul Ibanez 27 2.50 -0.28 0.89
Todd Walker 26 2.10 -0.29 0.86
Matt Lawton 38 1.97 -0.30 0.85
Russ Adams 28 4.09 -0.35 0.92
David Bell 30 2.85 -0.38 0.87
Jacque Jones 29 4.28 -0.43 0.90
Victor Martinez 25 1.49 -0.43 0.71
Angel Berroa 32 1.84 -0.46 0.75
Angel M. Berroa 32 1.84 -0.46 0.75
Scott Hatteberg 25 2.39 -0.48 0.80
Jeremy Reed 25 2.00 -0.54 0.73
Jayson Werth 25 1.12 -0.57 0.49
Jeff Kent 31 1.59 -0.57 0.64
Shawn Green 27 2.88 -0.62 0.79
Julio Lugo 48 7.07 -0.62 0.91
Felipe Lopez 51 5.28 -0.63 0.88
Moises Alou 28 3.19 -0.65 0.80
Coco Crisp 34 0.78 -0.69 0.12
Pat Burrell 25 4.12 -0.69 0.83
Rafael Furcal 38 4.73 -0.71 0.85
David Ortiz 34 2.38 -0.73 0.69
Richie Sexson 30 3.31 -0.80 0.76
Orlando Cabrera 29 1.59 -0.81 0.49
Emil Brown 25 3.06 -0.85 0.72
Jay Payton 28 1.20 -0.86 0.28
Mark Kotsay 29 3.32 -0.86 0.74
Dan Johnson 26 2.55 -0.88 0.66
Carl Crawford 36 4.29 -0.88 0.79
Pedro Feliz 32 1.48 -0.97 0.35
Lyle Overbay 27 3.27 -1.00 0.70
Jason Giambi 29 2.51 -1.00 0.60
Preston Wilson 26 3.96 -1.00 0.75
Chase Utley 33 2.69 -1.13 0.58
Adam Kennedy 25 1.67 -1.13 0.32
Edgar Renteria 32 3.41 -1.16 0.66
Omar Vizquel 33 3.26 -1.19 0.64
Brian Giles 31 2.91 -1.21 0.58
Freddy Sanchez 28 2.54 -1.23 0.52
Ken Griffey Jr. 27 1.91 -1.43 0.25
Derrek Lee 35 3.31 -1.47 0.56
Luis Castillo 37 2.42 -1.68 0.31
Shannon Stewart 25 2.34 -1.74 0.25
Tadahito Iguchi 33 3.31 -2.00 0.40
Joe Mauer 30 2.74 -2.02 0.26
Vladimir Guerrero 28 3.99 -2.35 0.41

Security Service Field

I wrote a little piece titled "Security Service Field: Context Matters" for the Colorado Springs Sky Sox web site (AAA affiliate of the Rockies) that some of you might be interested in. It's a primer on park factors which I thought would be of interest to Sky Sox fans whose team plays at an elevation of 6,531 feet which is the highest elevation of any park in professional baseball.

Wednesday, July 26, 2006

MLB Blackouts

Great article yesterday by Maury Brown on BP related to MLB's blackout restrictions. My favorite paragraph.

"Got your aspirin at the ready? Here are some examples. If you live in Oklahoma City, your restrictions involve the Astros, Rangers, Royals and Cardinals. The entire east side of New Mexico has the Diamondbacks, Rockies, Astros and Rangers. All of Iowa is blanketed with the Cubs, White Sox, Royals, Brewers, Twins, and Cardinals as blackout clubs. Buffalo, NY has the Indians, Mets, Yankees and Pirates as part of their "market" for blackouts. Charlotte, NC is blacked out by the Braves, Orioles, Nationals, and Reds. And finally, the all-time winner is Las Vegas, where the Padres, Diamondbacks, A’s, Giants, Dodgers, and Angels are all parties to blackout restrictions."

As Maury documents the arcane rules used today are pretty much insane. But the central point I think is that the business model being employed was developed for an earlier time period that no longer makes sense. And in truth the model probably didn't make any sense at the time it was formulated as Maury notes. The underlying idea is that media availability of a baseball game dissuades consumers from actually coming to games. I've never seen any evidence that the premise is in fact true but my sense from being a fan myself and talking to others is that it clearly is not. Watching a game on TV or listening on the radio serves to heighten interest in the team and makes fans more interested in attending games, buying merchandise, attending games in other cities when the team is visiting and on and on. The value of regional sports networks makes this clear - fans are being created on a regional basis by, surprise, actually watching games.

Seems like no brainer that all blackout restrictions are at least anachronistic.

Monday, July 24, 2006

The Trade Deadline Approaches

On Saturday evening as I caught a few minutes of Baseball Tonight my attention was piqued when former Mets GM Steve Phillips started pontificating about the plethora of teams that needed to make deals before the July 31st trading deadline in order to have a hope of making the post season. The list seemed even longer than usual and so it especially irked me, hence this post.

The reason I was irked is that the question of whether and how much these trade deadline deals impact pennant races was nicely handled by Dayn Perry in his excellent book Winners which I reviewed for THT back in March. Perry has a nice chapter there, an overview of which was included in the review and reproduced here.

The Art of the Deal


The Deadline Game (or, Why It's Hard to Win a Pennant in Two Months) was perhaps my favorite chapter, as it looked at in-season trades that approached the trade deadline for the 124 teams in the study.

What interested me, and what I had suspected, was that of the 108 teams that made such deals the average team realized only 2.2% of their total VORP from the trades, largely due to the fact that the season is two thirds over at the trade deadline and the remaining two months offer a sample size that can be heavily influenced by luck.

That said, Perry then goes on to discuss the teams that benefited the most from these deals, with the 1987 Giants and GM Al Rosen far surpassing the rest (15.5% of VORP), by snagging Dave Dravecky, Craig Lefferts, Kevin Mitchell, Rick Reuschel, and Don Robinson. Mitchell, Dravecky, and Lefferts were acquired almost a month before the trade deadline, a lesson that other GMs should note.

He also takes some time to credit Cardinals GM Walt Jocketty for making a series of excellent deals in both 2000 and 2002, and lauds his performance by saying that “whatever your standard for evaluation, Jocketty is peerless among modern GMs in making impact deals for his organization, deadline or otherwise”.

The end result is that for all the talk (and I understand it heightens interet in the game and is a good tool for ESPN to use to increase viewership), most of these deals most of the time aren't what the prognosticators crack them up to be. The reason so many people think they will be however, is probably due to our need to simplify complex outcomes into single factors (player x made the difference).

Friday, July 21, 2006

The Gene Pool Talking

I found this Prospectus Q&A interview of former pitcher Tom House by Jason Grady very interesting yesterday. In particular his comments about arm angles.

"I think we’re finally realizing you pretty much leave the gene pool alone and you position the gene pool on the rubber to accommodate what that youngster does--throwing across his body, striding straight or straight slightly open--and you spend time teaching timing than you do mechanical changes..."

"Research has revealed to us that pitchers have signatures. They are born with how they would throw a rock at a rabbit to eat. There are some conventional wisdoms that get in the way of that genetic signature: get on top, don’t throw sidearm, don’t short-arm the ball, reach back. There’re a number of them. But in effect, you should just leave whatever a pitcher does, whatever a kid does when he’s throwing a baseball with his throwing arm, just leave it alone. That’s his gene pool talking."

In other words, he's saying that teaching kids to throw from a particular arm slot is actually detrimental and that instead coaches should be focused on balance, posture, the proper way to throw breaking balls, and stride. Essentially let the kid figure out how to throw the baseball and then simply work to refine it.

To me this makes a good deal of sense. I'm often asked why so few people can throw a baseball at professional velocities and most can't and I think this cuts to the heart of the matter. It is simply "the gene pool talking" or rather, that given a particular set of physical characteristics, a particular person figures out (not necessarily cognitively but through repetition and muscle memory) how best to utilize those characteristics to put the maximum force behind the ball. In other words, it's not really something that can be taught by a father or coach.

I also was interested to hear his comments on throwing breaking pitches.

"Every pitch is thrown with the same mechanics, except for what wrist and forearm do. The biggest problem that youth pitchers have is they believe they have to twist to throw a breaking ball...After every throw, no matter position you are on a baseball field, when the ball leaves your hand, your palm will pronate into deceleration. The palm turns out [like throwing a screwball] so the reason a breaking ball is so hard on the elbow is that the kid is trying to twist into release point to create spin, then he’s twisting and untwisting in the same amount of time and the stress on the elbow joint grows exponentially greater while the arm is snapping straight."

I mentioned a few weeks ago that when I was at SABR36 I had the opportunity to hear Mike Marshall talk about pitching. Although his theories haven't enjoyed the same standing in the baseball community, if I understood him correctly, he was preaching essentially the same thing. Breaking balls are inherently tough on a pitcher's elbow because they are twisting it in the opposite direction in which it will naturally go when the ball is released. House's fix for this....

"So the fix for the whole thing is to preset stabilize. Start with the karate chop in the glove, come out and karate chop the curve ball. There is no spin. Karate chop the curve ball which puts the palm on the outside of the ball, the thumb and middle finger cutting through the middle of the ball and that’s what imparts proper rotation, safely. So whatever angle, if your palm is straight at the catcher, it’s a fastball. If you start getting towards karate chop, if you go one click, it’s a slider. Two clicks, slurve. Three clicks, curve ball. And the idea is to find whatever pitch, whatever breaking ball you want, preset that angle and keep that angle with the same mechanics your body has with a fastball from the time your hands break into release point and risk of injury is minimized."

This too sounds much like what Marshall was saying in terms of presetting the orientation of the wrist and releasing the ball with the same motion on every pitch. I'll admit that I was taught to throw a curveball by coming over the top with the my arm and "pulling the window shade" by cranking my wrist over and almost snapping the ball out of my hand. My coach, like thousands of others, taught snapping the ball as a means of practice or strengthening your fingers for this type of release. I'll have to admit that this technique was effective and my curve was my best pitch and even though I was never one whose body figured out how to throw at professional velocities, now I wonder what it would have been like at a young age to get this kind of instruction to see what kind of a difference it might have made.

You'll have to subscribe to read the rest of this fascinating interview.

Thursday, July 20, 2006

A Blunder of my Own

My favorable review of Rob Neyer's new book on blunders is up on BP this morning. I've already gotten some feedback from readers on one paragraph that goes like this:


"Taken one at a time, what those [Neyer's crtieria for inclusion] mean is that the move must have a) been well considered and not simply an act which is the product of historical contingency (it could have been otherwise), b) a physical error (a dropped throw or missed catch), or c) a heat-of-the-moment reaction (a missed call or a Zidane-style head butt, for which there is no event in baseball history that really comes close). Second and by far the most important, there had to be at least some rationale available at the time for not making the move. After all, anyone can play Monday morning quarterback, but it's far more difficult to articulate a reasoned case before the results of an event are known. Finally and most obviously, the move had to have ill effects on the franchise in question, therefore making it a blunder."

While writing this paragraph the event that slipped my mind was the clubbing of Johnny Roseboro by Juan Marichal on August 22, 1965. Viewed from a modern perspective the $1,750 fine and eight game suspension seems like a severe underreaction by NL president Warren Giles. That sort of incident today (witness the 50 game suspension handed out to Delmon Young for the bat throwing incident earlier this season) would certainly merit a punishment ten times as harsh. Roseboro later sued Marichal for $110,000 and the case was settled for $7,000 according to this source.

Now I have a blunder to call my own.

Tuesday, July 18, 2006

Chat Transcript

Here is the link to the chat transcript from BP today. Thanks to all who participated.

Monday, July 17, 2006

Chat Tomorrow

Just wanted to remind folks that I'll be chatting on Baseball Prospectus tomorrow from 1-2:30pm eastern time (I know it says 3pm eastern but that will be changed). If you submit your questions early I'll have hopefully more complete answers so take advantage.

Tuesday, July 11, 2006

Baseball's Secret Formula

As I'm sure many of you did I watched Baseball's Secret Formula last night. My overall review is positive because I think it did justice to the basic ideas of sabermetrics on a level that the general viewer could understand. Unfortunately my wife is out of town and didn't get to see it because I wanted to use her as a test case for gauging the program's understandability if you will.

Visually, the program was very well put together and included helpful graphics along the way (except for the senseless equations that would popup in the background from time to time). Concepts like runs created, linear weights, win shares, run expectancy, similarity scores, and win probability were all presented in a way that made sense. The biography of Bill James, the interview with Sandy Alderson and Alan Schwarz's contributions were also very good. My favorite part, however, were the comments by Terry Francona as he asserted that baseball as an industry is behind the times and that he's open to discussing issues with James; they even showed the two of them talking apparently during spring training.

As expected the show stressed that these ideas came from outsiders and James had a nice short description of using the outside perspective while the screen showed his image appearing in many seats in the grandstand. I was a little disappointed that similarity scores were given what to me was a weight way beyond their importance in the performance analysis community. I assume the producers of the show did that because they were trying to tie in the Hall of Fame somehow. As a writer for BP that's where performance projection ala PECOTA should have been discussed.

The show ended with a nice discussion of the inadequacies of fielding statistics and an interview with John Dewan that discussed how BIS collects fielding data published in The Fielding Bible.

I'd be interested to hear what others thought...

A Blackout?

Was just alerted to this interesting article titled BASEBALL'S BLACKOUT. It is set to be a multi-part article but the first piece was intriguing for several reasons.

The author's thesis is that "baseball as an industry and as a culture has regressed with a radical blackout harkening to the days of separate but equal". As evidence he cites the facts:

  • "Three decades after blacks made up nearly 30 percent of major league rosters, they now make up 8.5 percent -- less than half the 17.25 percent of 1959, the first year every team was integrated."

  • "After making up 27.5 percent of teams in 1975, blacks represented less than 20 percent in the '90s and 15 percent or less since 1997."


  • "Among the 240 players represented on the eight teams at last month's College World Series, a count of the rosters reveals only four everyday African-American players. The NCAA reports that blacks make up only 6 percent of Division I baseball rosters this year."


  • "During the 2006 season, only six African-American players out of 288, less than one percent, were listed on the rosters of the eight L.A. Area Division I baseball programs."


  • "Only two out of the first 30 players selected were African-American."


  • The primary cause that lies behind these facts in the author's opinion is that teams now choose to draft primarily college players and that high school players drafted come from elite travel teams that are cost prohibitive for many African Americans. Further, he suggests that college coaches shy away from recruiting black players "because they fear developing their skills and accepting the social, economic and family responsibilities that often accompany an inner-city athlete."

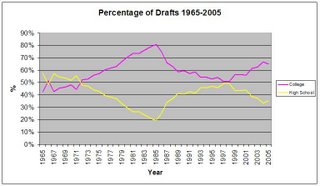
    While college players had been drafted in greater numbers very recently (1998-2004), high school players (as shown in the following graph) were drafted in much greater numbers in the preceding 15 years and so I doubt that the mix of college and high school draftees has much to do with it although certainly the economics of travel teams may play a role.


    The unfortunate aspect of the article is that instead of digging deeper into the economic disparity that may help to effectively bar entry or the breakdown of the African American family not to mention the displacement of baseball in the community with basketball and the rise of Latin and Asian players in the last 20 years, the author instead makes some very thinly veiled suggestions that racism is the underlying or root cause. I'm not buying it for the simple reason that our society is surely more open today than it was 40 years ago and yet blacks had seemingly less trouble entering and winning rosters spots. I'm afraid the real causes are probably much more complex than simply racism and have more to do with the characteristics of the African American community and less to do with outside discrimination.

    Monday, July 10, 2006

    Baseball History IQ

    For those who want to test their baseball IQs take a look at this quiz on ESPN. What I found most interesting are the scores by major leaguers and other analysts.

    Top score for players was Kevin Mench at 40 with Mike Meyers at 35, Mark Grudzielanek at 34 and Joe Maddon at 31. Gary Gillette took the top spot for ESPN analysts at 45 with Rob Neyer at 43 and Keith Law and Jim Caple at 41. I scored a 38 and missed a couple of easy ones by not fully reading the question ("who debuted as the oldest player not played as the oldest"). Anyway, interesting stuff.

    Sunday, July 09, 2006

    Career Length Musings

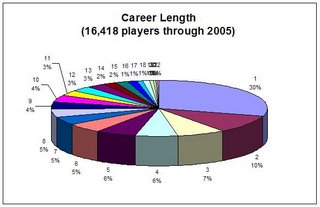
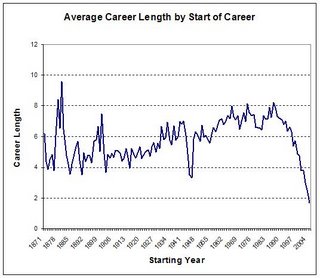
    While I was at the recent SABR convention I attended the Bio Project committee meeting where the aim is to record a biography for each of the more than 16,000 players who have played major league baseball. That got me to think about a) the difficulty of such a project as more players enter the league each year than biographies being written, and b) how many of these players are ones most of us have never heard of. And that got me to thinking about career length so I took a few minutes tonight to create the following two graphs.

    The first is a pie chart that shows the percentage of players whose careers have spanned a certain number of years. Note that this includes 16,418 of the 16,556 players in the Lahman database (only those who show up in the batting or fielding record). And what it shows is that fully 53% of the players have careers that span four years or less and 74% span eight years or less (and I say span because it includes first and last appearance and not individual seasons).


    The second graph shows the average career length by debut year. In other words beginning around 1900 career lengths were between four and five years which steadily rose until World War II when it dipped considerably as players who debuted in 1944 and 1945 had career lengths that averaged 3.5 and 3.3 years. The march continued on until it peaked around 1986 at 8.2 years and then began declining because an increasing number of players who debuted after that are still active. I could have excluded them but then of course that would have skewed the numbers for 1986 and after downward to include only players who are no longer active. The more recent are also skewed downward since it is common for minor leaguers to not appear in one or or more seasons after their debut.

    Interestingly, there is also a dip in the 1977-1980 period which may be associated with the advent of free agency (coupled with expansion) as teams tried to stock up on younger players(?). I assume that the increasing career length can attributed to a number of causes which include (in descending order by importance); better medical care for players that enables them to play longer; higher salaries and therefore greater investment by teams and greater incentive by players to continue playing; the greater skill required to play the game at this level which engenders greater incentive to continue to improve and retain one's position.

    It's also interesting to note that career length dipped slightly in the expansion years of 1961, 1969, 1977, and 1993.

    Secret and Soggy Formulas

    I know this has been talked about in several forums already but I'm late to the party in noting that The Science Channel will air a program titled "Baseball's Secret Formula" starting tomorrow that will supposedly talk about Bill James and sabermetrics. In fact, in the program guide on my cable system it actually uses the word "sabermetrics" in the description - perhaps the first time I've seen that.

    While the Science Channel web site doesn't have much info there is a commerical they're running that goes like this:

    "See how a simple set of equations is revolutionizing Americas past-time the use of mathematics is changing the way baseball is played. There's only so much you can do with statistics about put outs, assist and errors. These guys know how to spot talent but now the secret is out, the Science Channel steps up to the plate and reveals how one team went from cursed to first"

    Jason Varitek, "You have to utilize all the information you have to formulate the best plan you can" Quoted while showing a computer screen inputing statistical data.

    Terry Francona BoSox manager, "You here a lot of older baseball people say this is crazy"
    I've got it setup to record and it'll be interesting to see how performance analysis is spun.

    In other news I spent a soggy afternoon at Coors Field. We've had rain in Colorado Springs the last five or six days and today it was misting as I entered the ballpark at 11:45AM and it continued to do so throughout the entire game. I've never attended a game where it rained the entire time and yet there was no delay. The grounds crew just kept pouring that quick dry compound on the field between innings and luckily I was able to sit under the first deck and kept dry (but not really warm - it was about 60 degrees at game time and got colder as we went).

    The game was also disappointing as the Rockies bullpen again imploded. In the 7th inning Aaron Cook went out and after getting Orlando Hudson to line out to center gave up line drive singles to Chris Snyder and Jeff DaVanon. Clint Hurdle then brought in Tom Martin (L) to pitch to Craig Counsell (L) who also singled. Then Hurdle brought in Scott Dohmann (R) to pitch to Eric Byrnes (R) who walked. Then Hurdle brought in Ray King (L) to pitch to Chad Tracy (L) who also singled. Then Hurdle brought in Jose Mesa (R) to pitch to Connor Jackson (R). Jackson hit a fly ball to left which Matt Holliday promptly dropped allowing in the tying and what turned out to be the winning run in an 8-5 loss. At least Hurdle's "playing the percentages". Right. For those of you scoring at home that's five consecutive hitters facing five different pitchers. I wonder how often that's been done before?

    Last night of course the Rox bullpen gave up seven runs in the top of the ninth to give the Diamondbacks an 8-1 lead before the Rockies scored 6 runs in the bottom of the ninth to lose 8-7 and in the process setting a record for most runs scored in the ninth inning when beginning the inning tied 1-1. So now the Rockies limp into the break having been swept and just a game over .500. It is however, only the fourth time in their fourteen year history that they've reached the break with better than a .500 record.

    Friday, July 07, 2006

    SABR36 Recap

    Here's a few other SABR36 reviews and experiences you might want to check out.


    Recap of SABR 36 (images and audio) - Maury Brown

    2006 SABR Convention Recap - Aaron Gleeman


    And if you're interested in some of the details of a few of the presentations take a look at my column from yesterday. I'll have part 2 later today.

    Update: Forgot this two-parter by Jay Jaffe:
    Rattling SABRs in Seattle -- Part II
    Rattling SABRs in Seattle -- Part I

    And my own second review of some of the research presentations is on BP.

    Plunking Biggio

    In my BP column earlier this season I took a three part look at the history and theories that have been posited to explain fluctuations in hit by pitches. At the time I didn't know about the site George Will recently referenced in one of his columns at the start of the season.

    Michael Bourn needs to get out more. A database programmer in Nashua, N.H., he created the Web site plunkbiggio.blogspot.com that tells everything--
    really, everything--about the 273 times that Craig Biggio of the Astros has
    been hit by a pitch, the modern major-league record.

    On average, Biggio's plunks have occurred 493 feet above sea level, up 36 feet after two plunkings last year in Denver. The shortest pitcher to hit him? Byung-Hyun Kim (5 feet 9 inches). The average age and weight of the plunking pitchers are 28.5 and 200.22. He has been hit most often by pitchers whose astrological sign is Sagittarius, but more Leos have hit him. He has been hit 15 times while Tiger Woods was on Sports Illustrated's cover. In 1997, the Dow rose an average of 28.63 on trading days after Biggio was hit. And on, and on.

    Why does Bourn do this? "It is better than following Ruben Sierra's approach to the sacrifice-fly record." (Sierra is nine short of Eddie Murray's 128. Feel the excitement.) An obsessive-compulsive fascination with numbers is an occupational hazard of baseball fans. Baseball, unlike games of flow such as hockey, soccer and basketball, is a series of episodes that encourage quantification. This week, baseball resumes its prodigious production of numbers in another season of 2,430 games with 21,870 innings and approximately 700,000 pitches during 166,000 at-bats. The rage to quantify--to reduce reality to measurable units--is an impulse in modern
    societies.

    And aren't we all glad that our society has such an impulse?

    Thursday, July 06, 2006

    Baseball and the Academy

    My father-in-law who is a medical librarian and baseball fan occasionally finds abstracts or articles relevant to baseball. Here's a recent batch that I thought you might find interesting (who says academics are boring?)

    The relationship between age and baseball pitching kinematics in professional baseball pitchers.
    American Sports Medicine Institute

    Joint range of motion and physical capacities have been shown to change with age in both throwing athletes and non-athletes. The age of professional baseball pitchers could span from late teens to mid-40s. However, the effects of age on the pitching kinematics among professional baseball pitchers are still unknown. In this study, 67 healthy professional baseball pitchers were tested using a 3D motion analysis system. Their mean age was 23.7+/-3.3 years (range 18.8-34.4). The 12 pitchers more than one standard deviation older than the mean (i.e., older than 27.0 years) were categorized into the older group, and the 10 pitchers more than one standard deviation younger than the mean (i.e., younger than 20.4 years) were defined as the younger group. In all, 18 kinematic variables (14 position and 4 velocity) were calculated, and Student's t-tests were used to compare the variables between the two groups. Six position variables were found to be significantly different between the two groups. At the instant of lead foot contact, the older group had a shorter stride, a more closed pelvis orientation, and a more closed upper trunk orientation. The older group also produced less shoulder external rotation during the arm cocking phase, more lead knee flexion at ball release, and less forward trunk tilt at ball release. Ball velocity and body segment velocity variables showed no significant differences between the two groups. Thus, differences in specific pitching kinematic variables among professional baseball pitchers of different age groups were not associated with significant differences in ball velocities between groups. The current results suggest that both biological changes and technique adaptations occur during the career of a professional baseball pitcher.


    An examination of the "hot hand" in professional golfers.
    Department of Psychology, University of North Texas

    A study investigated the "hot hand" among professional golfers. Hole-to-hole scores within 747 tournaments from a randomly chosen group of 35 players on
    the 1997 PGA Tour were analyzed. Contingency analyses gave no evidence for the "hot hand". Players were just as likely to score a birdie or better following a par or worse hole as make a birdie or better following a birdie or better hole. These results are consistent with those found for individual players in baseball and basketball.

    I thought this was interesting since the hot hand is also of interest in baseball. It also made me wonder just where does one go to get PGA data?.


    Naive beliefs in baseball: systematic distortion in perceived time of apex for fly balls.
    Department of Psychology, Ohio State University-Mansfield

    When fielders catch fly balls they use geometric properties to optically maintain control over the ball. The strategy provides ongoing guidance without indicating precise positional information concerning where the ball is located in space. Here, the authors show that observers have striking misconceptions about what the motion of projectiles should look like from various perspectives and that they estimate when the physical apex of a fly ball occurs to be far later than actual, irrespective of baseball experience. Their estimations are consistent with the highest point they are looking at as the ball approaches, not with the physical apex. These findings introduce a new and robust effect in intuitive perception in which people confuse their perceptual perspective with the physical situation that they mentally represent.


    Determining whether a ball will land behind or in front of you: not just a combination of expansion and angular velocity.
    Max Planck Institute for Biological Cybernetics

    We propose and evaluate a source of information that ball catchers may use to determine whether a ball will land behind or in front of them. It combines estimates for the ball's horizontal and vertical speed. These estimates are based, respectively, on the rate of angular expansion and vertical velocity. Our variable could account for ball catchers' data of Oudejans et al. [The effects of baseball experience on movement initiation in catching fly balls. Journal of Sports Sciences, 15, 587-595], but those data could also be explained by the use of angular expansion alone. We therefore conducted additional experiments in which we asked subjects where simulated balls would land under conditions in which both angular expansion and vertical velocity must be combined for obtaining a correct response. Subjects made systematic errors. We found evidence for the use of angular velocity but hardly any indication for the use of angular expansion. Thus, if catchers use a strategy that involves combining vertical and horizontal estimates of the ball's speed, they do not obtain their estimates of the horizontal component from the rate of expansion alone.


    Optical trajectories and the informational basis of fly ball catching.
    The RAND Corporation

    D. M. Shaffer and M. K. McBeath (see record 2002-02027-006) plotted the optical trajectories of uncatchable fly balls and concluded that linear optical trajectory is the informational basis of the actions taken to catch these balls. P. McLeod, N. Reed, and Z. Dienes (see record 2002-11140-016) replotted these trajectories in terms of changes in the tangent of optical angle over time and concluded that optical acceleration is the informational basis of fielder actions. Neither of these conclusions is warranted, however, because the optical trajectories of even uncatchable balls confound the information that is the basis of fielder action with the effects of those same actions on these trajectories. To determine the informational basis of fielder action, it is necessary to do the control-theory-based Test for the Controlled Variable, in which the informational basis of catching is found by looking for features of optical trajectories that are protected from experimentally or naturally applied disturbances.

    Wednesday, July 05, 2006

    The Inequities of Interleague

    Well, interleague play is over for another season. This season the two leagues played 252 games against one another with the AL taking a decisive 154 games for a hefty winning percentage of .611. The AL has also won the last 10 All-Star games and six of the last eight World Series. A lot has been made about the big difference between the leagues this season and I even caught this quote from USA Today last Friday:


    "It's enough to make AL general managers take a harder look at NL pitchers at the trade deadline. Just because a pitcher is having success in the NL doesn't mean it will translate into the same performance in the American League.

    'For the first time,' [Billy] Beane said, 'we're going to have to take a harder look at that. But at the same time, I don't want to get carried away. The Mets are still a good club, no matter what league they play in. And there's no question in my mind the Cardinals would be winning over here too. It's just a bad time to be in the American League these days.'"


    What's interesting of course is that Beane is intimating that perhaps in the future they'll be applying league adjustments to project NL players when they move into the AL and vice versa. That's the sort of thing that performance analysts haven't done at the major league level but of course are familiar with when translating statistics between say, the Federal League and the AL or AAA and the majors. Clay Davenport's Davenport Translations (DTs) apply these kinds of adjustments.

    But the question is whether the AL is really the stronger league and if so by how much? First, I should mention that since interleague play was initiated the NL had the advantage pre-2006 at 1,104-1,096 and now the AL has taken the edge at 1,250-1,202. As a result, if there is a strength advantage for the AL, that advantage hasn't manifested itself until recently. Last season they went 136-106 and so now are 290-204 over the past two seasons. Second, there are different views about how to try and measure the strengths of various leagues. Obviously setting a baseline to use a measuring stick is the most apparent one. Mitchel Lichtman this morning started a two-part series on The Hardball Times that explores this issue and so you'll want to stay tuned for part 2 tomorrow. I can say that in a preliminary analysis Clay Davenport's technique that attempts to measure league differences hasn't detected a difference for 2006. Jim Baker also takes the position of many that it's probably too early to tell and that we'll need a few years of data to make more definitive statements either way.

    Additionally, I found it interesting that the AL also overshot it's pythagorean record against the NL in 2006. This year the AL scored 1,336 runs and the NL 1,115. That works out to a projected record of 148-104 for the AL, six games worse than their actual record. That's still a pretty hefty advantage however. It turns out the Rockies were the best NL team in interleague play going 11-4 while the Giants were second at 8-7 making them the only two NL teams with winning records. One of the points that Lichtman makes in his article this morning which I found interesting is that despite the AL having the advantage offensively by having a player who is naturally a DH (NL DH's do worse than their AL counterparts in interleague games), NL pitchers make up some of the difference and in the end that difference accounts for only about a half a win per year.

    On the attendance front interleague games drew an average of 34,097 fans which eclipsed the record of 33,703 set in 2001. Overall interleague games drew 15.5% more fans than other games which averaged 29,520 fans thus far. Since 1997 interleague games have drawn 13.2% more fans than other games. And that means it's hear for the forseeable future.

    Not surprisingly Joe Mauer hit .492 (30-61) in interleague games to lead everyone and David Ortiz hit 9 homeruns with Ryan Howard second with 8. Francisco Liriano went 5-0 while Johann Santana had a 0.82 ERA.

    Update: Lichtman has published his second article on AL and NL differences over at THT.

    Update: Part three is now available.

    Sunday, July 02, 2006

    SABR36: Day 4

    Well, as I wing my way back to the Front Range I'll recap my final day of SABR36, one that was loaded with research presentations.

  • I sat in on Norman Macht's discussion titled " Baseball: Why this Passion?" in which the author of more than 30 books and an upcoming biography of Connie Mack outlined the reasons he believes baseball resonates so forcefully with the American public. These reasons range from the simple fact that people enjoy good stories which baseball provides in the short story of the individual game to the novel of a season, to the sense of community and belonging that satisfies the sublimation of our tribal instinct. But most of all I enjoyed his illustration of the latter point through the retelling of a humorous story about a Brooklyn man and his son who watched Ted Kluszewski beat the Dodgers on a 9th inning homerun and how the next few hours transpired as the father interacted with his wife, brother-in-law, and neighbors regarding the game.


  • The was a panel of former Pacific Coast League (PCL) players who reminisced about the teams and players from the 1940s through the 60s. All were entertaining of course and provided a sense of how the PCL was viewed on an almost level playing field with the majors in those days.


  • A presentation by Baseball Reference's Sean Foreman titled "Better Defense Through Bruising" looking at passed balls and wild pitches was very well done and later in the day won the award for best presentation. Sean's study can be found here and I'll have more to say about it next week in my column for BP.


  • From there I took in Dave Smith's (of Retrosheet) talk on the "Effect of Batting Order (not Lineup) on Scoring". In short Smith looked at run scoring patterns across innings based on which lineup slot led off the inning using data from 1957-2005 comprising over 95,000 games. He concluded that lineup slot of the first batter in an inning matters a great deal in a team's average scoring and that lineups appear to be well designed in that the best scoring results are seen when the man in the leadoff slot bats first in any inning. In his comments, however, he appeared to contradict the conventional sabermetric wisdom that lineup construction (in other words the order in which players appear in the order) matters little over the course of a season, however I don't believe his data really spoke to the issue. What caught the attention of most listeners, however, was a side note comment he made that he found that walk-off wins occur on average just over once in every ten games. Given the current full slate of 15 games in a day, that means that on average a walk-off occurs every day. I'll have to admit that seems counterintuitive and caught me by surprise.


  • In what was perhaps my favorite talk (and longest title) of the convention Jeff Angus, author of Management By Baseball, presented on "Punctuated Equilibrium in the Bullpen: The 2005 World Champion White Sox Blend Sabermetrics & Sociology to Deliver Successful Innovation". Angus talked about what he called the "origin myth" of Herman Franks and Bruce Sutter inventing the role of the modern closer as well the myth that Tony LaRussa and Dennis Eckersley did so. Instead he favors Jeff Torborg and Jim Fregosi for reasons I'll discuss in my column and then goes on to discuss the strategy employed by the 2005 White Sox and how that differs from what has become the traditional model.


  • Clem Comly of Retrosheet then discussed the issues that Retrosheet volunteers face when inputing and cleaning up data in a talk titled "Hindsight is not always 20/20 Or, How I learned to Stop Worrying and Love Heisenberg". Comly outline the various types of discrepancies they face and showed examples of each. He also noted that these discrepancies exist in the published data on retrosheet but mostly effect years prior to the 1980s. For example, 3% of the batting records have discrepancies in 1957, and 9% of pitching records do versus effectively 0% by 1984. For that reason analysis done by researchers will need to take these discrepancies into account and Retrosheet is striving to make public which records are at issue on the site itself.


  • What was perhaps the highlight of the day for many was the CBA panel moderator by Rob Neyer which included Dick Moss (former lead counsel or as he said, "only lawyer" for the player's union), author Andrew Zimbalist, and Mike Marshall who served as a player representative. After a brief history of labor negotiations in which Moss and Marshall retold a few war stories the discussion turned to the existing and future agreements. When asked by Neyer why we haven't heard anything about any discussions, Moss pointedly remarked that it's because "the parties don't want you to know anything". He then added that talks were ongoing and that the parties feel they can make better progress out of the public eye. Zimbalist appeared to have the best grasp on the current situation but all agreed that this time around there probably would not be a work stoppage since there is too much money at stake and the rising tide of revenue and salaries coupled with the fact that basic rights issues have been resolved make the players less militant.


  • After the CBA panel there was a slight delay as the room was cleared but then former BP'er Jonah Keri took the podium and presented the chapter "Is A-Rod Overpaid?" from Baseball Between the Numbers. I had never met Jonah and we was an engaging speaker and presented the material originally developed by Nate Silver in a very easy to understand and persuasive way. For the details you'll need to buy the book but in short, yes, A-Rod by several different measures, is overpaid.


  • To round out the day of presentations Mark Pankin presented a talk on the relative value of on base percentage vs. slugging percentage called "Can On Base Percentage be Worth Three Times More than Slugging Average?" which was created in response to the passage in Moneyball where Paul DePodesta (now of the Padres by the way) notes that they value an additional point of OBP at three times the value of an additional point of SLUG. Pankin uses a Markov Model in his analysis and concludes that in 2005 OBP was worth 1.88 times SLUG while historically the value has gone from around 1.4 to about 1.95.


  • After the presentation were over I hung around to watch the trivia contest. First there were the finals of the team competition and then the individuals which last until around 9:30pm. THT's Steve Treder came in second place and all the competitors wowed the crowd with their knowledge of the truly trivial (one category was second place finishes and asked the constestants questions like, "who finished second in hit batsmen in 1956?").

    Up early this morning and now back in Colorado Springs after a long but very interesting and entertaining four days in the Emerald City.

    Saturday, July 01, 2006

    SABR Day 3: Afternoon and Evening

    One of the regrets I have about the convention is that I didn't purchase a ticket for the awards luncheon. However, the events therein were described by fellow SABR member Larry Stone in a nice article this morning in The Seattle Times. In particular Stone reported on Jim Bouton's keynote address in which he discussed the topic of steroids and performance enhancers. Among the comments Bouton made on the subject Stone notes that Bouton feels that steroids have caused:

    "a crisis of confidence among fans that has put the integrity of the game at stake. This is worse than the 1919 Black Sox scandal. Far more games have been compromised by steroid use than ever by gambling."

    While I think that's probably true, I also don't think most fans really understand the extent to which gambling played a role in pre-1920 baseball. This was brought to my attention last year when I read the fine biography of Black Sox participant Hal Chase titled The Black Prince of Baseball.

    Bouton went on to propose forming "a SABR-led panel to determine the impact of steroids on slugging". The panel would then develop a new statistic termed the "Steroid Adjusted Number" or SAN to appear in parenthesis next to the actual number of homeruns in record books and online. Apparently, the idea is that the SAN could be removed if, in Bouton's words,

    "history shows the actual homers hit were not an aberration, just as time has removed the imaginary asterisk next to Roger Maris' 61 homers in 1961. But if history shows the actual home runs were an aberration, they would end up in parentheses, and the SAN would be recognized as legitimate."

    Well, obviously this sort of talk has been brought up before but the problems with it are so many and so varied it's hard to know where to begin.

    I'll be the first to admit that I don't view Barry Bonds' home runs in recent seasons as legitimate, but the fundamental problem is that there are so many interconnecting effects of performance enhancers that it is effectively impossible to quantify their effects on batting and pitching lines (don't forget that pitchers use PEDs as well). Much like the notion that a butterfly's wings flapping in central park causes a rain storm in China, one hitter's PED use effects multiple pitchers and in turn other hitters which changes the interactions with other pitchers ad infinitum. And of course this doesn't just effect home runs as implied in Bouton's comments. PEDs certainly have an effect on other extra base hits which also effects singles, batting average, slugging percentage, walks (as pitchers pitch more carefully to bulked-up hitters with the ultimate example being Bonds himself), and on base percentage among others. Taken to the logical extreme what you'd end up with is an asterisk next to every number of every player for an entire era which makes the notion silly at its core.

    Just as students of the game recognize the offensive environments that obtained in the deadball era, the 1930s, and the 1960s, and make adjustments (both quantitative and qualitative) accordingly, they will make the same kind of adjustments for individuals we know benefited like Bonds and for the era as a whole.


    Stepping down off my soapbox the evening was concluded with a trip to SafeCo field to see the Mariners take on the Rockies. While the game wasn't historic it was a very unique game. Josh Fogg was very sharp and set down 27 batters in a row thanks to three double plays enroute to a 2-hitter completed in 1:52 minutes and 90 pitches. The Rockies scored a run in the fifth on a Jamey Carroll single and added a Brad Hawpe homer in the 7th for the 2-0 win. Many in the group lamented the shortest game in SafeCo and Rockies history since it provided less time to converse. For those of us who follow the Rockies it was just fine.