
While leafing through some old papers at my parents house last summer I came across a blue binder that contained roughly 20 pages of green bar paper filled with dot-matrix printing. Upon further inspection the binder contained my first sabermetric "studies" from the winter of 1982-1983 when I was a wee-lad of 14. While a detour into the mind of a 14-year old might not sound very instructive, looking at these studies reminded me of several concepts I later learned about baseball statistics and so since you obviously have nothing better to do, I thought I'd share some of those with you today.
The studies were performed with the help of an Osborne 1 personal computer that my Dad had purchased the winter before. The Osborne was released in April of 1981 and included 64K of RAM, a 5" screen (we subsequently purchased a 14" orange screen monitor), two 91K disk drives, and the CP/M operating system. It was the first "portable" computer and the keyboard could be attached to the CPU so that the it would pack up like a very heavy and bulky suitcase.
I remember vividly that while in the "showroom" in the winter of 1981 my Dad asked the salesman about the differences between the Osborne and the new IBM PC and its DOS operating system. The slick salesman assured my Dad that CP/M was the way to go and that Osborne would be around for a long time. Well, that didn't really work out but that Osborne did come with a spreadsheet (SuperCalc), Wordstar, Microsoft MBASIC, and Dbase II. It was SuperCalc and Dbase II that I used extensively in my baseball research.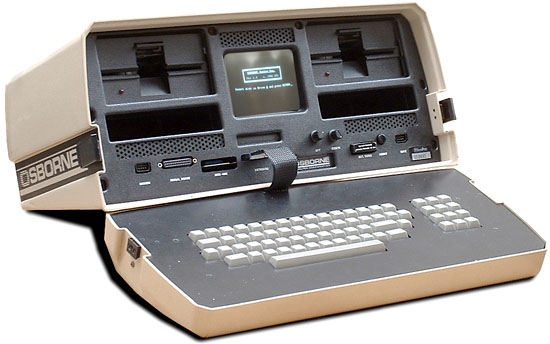
My other tools I used in the studies were my first Baseball Encyclopedia that I purchase around this time and which sits proudly on my shelf next to the desk at which I'm typing, and the book Daguerreotypes which was published by the Sporting News and was a register of I believe Hall of Fame players.
That winter I joined SABR and promptly let my membership lapse as girls and other pursuits caught my attention. I came to my senses and rejoined in 2003.
I didn't read my first Baseball Abstract until 1984 although I must have run across some of Bill James' writing since I see Runs Created mentioned in one of the studies. I'm sure you're all dying to find out just what a 14 year-old in the bad old days before the internet (we did have a 300 baud modem that fit into the floppy drive slot and from which we could dial long distance into bulletin boards with lots of crappy software) could have possibly written about.
So in looking through the binder here were the studies, my sometimes strange conclusions, and what I was missing:
What I reported was that NL pitchers who had pitched 200 innings or more in 1971 went on to pitch 6.18 more years while AL pitchers who pitched 200 innings or more in 1972 had careers 5.24 years longer. I was no doubt pleased to report that the DH shortened the careers of pitchers by almost a year. Of course I wasn't really aware of the dangers of small sample size and so my study included only 25 AL pitchers and 22 NL pitchers and I made no allowance for pitchers changing leagues. In the end, I have no idea whether the DH did shorten careers but I'm pretty sure this study wouldn't have found it if it did.
My results were HR - 3.52, BA - 3.43, FA - 3.19, ERA - 2.62, SB - 4.43. I'm not sure what if anything I concluded from this as the rest of the page is blank, but of course this study was flawed since park effects weren't taken into account and because the sample size was small including only World Champions - not to mention the fact that the winner of the World Series is not the best team in baseball a majority of the time.
In any case the data shows that Veterans Stadium increased runs by 20.6% while Dodger Stadium depressed runs by 13%. Other hitters parks were Riverfront, 3 Rivers, and Fulton Country Stadium. Once again I probably looked only at a single year and I now know that park factors, while useful, fluctuate wildly from year to year. They should be calculated over a three or five year time period and then be regressed to the mean.
I also noted that the Western division as a whole went 265-323 against the East. For good measure I included the Royals' starters totals and showed they performed better against the West than the East as well. My conclusion: "...all I can say is that my friend who asked me this question should know what he's talking about before he starts talking." Not well written but I can't argue with the conclusion (at least for 1982).
Right handed hitter vs. left handed pitcher: .209
Right handed hitter vs. right handed pitcher: .333
Left handed hitter vs. left handed pitcher: .289
Right handed hitter vs. left handed pitcher: .303
My conclusion was that announcers are wrong when they talk about a general platoon advantage and any differences probably have more to do with the individual and how much "practice" they get against each side. Well, my sample size here was really small with left vs. left at only 38 at bats and right vs. left with only 115 at bats and so the results are obviously meaningless. In fact, the batting average over the entire sample was .300. The other problem, of course, is that the sample was taken probably almost exclusively from Cubs games, those being the only games that we were regularly able to watch in eastern Iowa at the time.
Using retrosheet data here are the actual splits for the 1982 season:
Bats   Throws      PA     AVG   OBP    SLUG
R      R        59110   0.255  0.305  0.381
L      R        38048   0.270  0.329  0.405
B      R        15403   0.263  0.317  0.367
L      L        11078   0.253  0.312  0.362
B      L         6799   0.250  0.294  0.350
R      L        30666   0.268  0.321  0.413
This study brings to mind the article "Underestimating the Fog" that Bill James wrote for the Baseball Research Journal last spring and that stirred the waters of the sabermetric community a bit. In that article James criticizes the common technique employed in various sabermetric studies that are typically cited to "prove" conclusions - for example James' own look at platoon differentials in the 1988 Baseball Abstract. That technique involves the search for recurrence or persistence of the phenomena being studied using year to year correlations. In other words, James did a study that attempted to determine if platoon differentials persisted across seasons. He found that they did not for individual players and so concluded that hitters have no individual ability to hit well or poorly against left-handed pitching but that there is a strong group tendency to do so.
James then argues that in this cases as in others the negative conclusion - the phenomena is not real - is flawed because there is too much instability in the data used to make the conclusion. For example, the conclusion that there is no specific ability to hit well or poorly against left-handed pitching is based on platoon differentials where the number of plate appearances against left-handed pitchers is around 120 in a season. The randomness involved in such a small sample size tends to swamp the differential itself, thereby making the results meaningless.
While the number of at bats in each count wasn't large, these results were more significant because of the big differences between the various accounts and track pretty nicely with a more recent query I ran on counts for 2004. What I was missing in this analysis is the effect of strikeouts. On several of the pitcher's pitches (0-2,1-2,2-2, 3-2) the batter has the chance of striking out whereas on hitter's counts a swing and miss or a pitch taken for a strike doesn't depress the batting average. By taking the strikeouts out of the picture what you learn is that while batting average is generally lower in pitcher's counts, it is the slugging percentage that suffers most. In other words, as common sense would dictate, with two strikes hitters often sacrifice power at the expense of average as they look to protect the strike zone and the put the ball in play.
To compute this rating I assigned weights to nine different offensive categories as follows:
Single      275
Double      350
Triple      400
Homerun     500
Stolen Base 250
Run         375
Walk        235
Strikeout  -275
RBI         425
I used as my sample all of the players in the book Daguerreotypes and included the recently retired Willie Stargell, Bobby Bonds, and Reggie Smith. To calculate the rating I then divided the career totals in each of the nine categories by the player's number of at bats and then multiplied this rate by the weight. After adding up each of the weighted values I then ranked the players by this rating. For players whose statistics were incomplete I projected their career totals using the rate for that part of their career for which data was present.
This study was carried out using Dbase II and I remember painstakingly typing in the statistics for the approximately 275 players in the book. The exercise of performing the calculations did force me to learn the Dbase programming language, which of course had a pretty long shelf life and which I used in a college job doing FoxBase programming at Iowa State University. I know you're dying to see who really were the greatest offensive players of all time so...
Babe Ruth      346.0
Ted William    342.1
Lou Gehrig     329.5
Billy Hamilton 316.6
John McGraw    306.2
Joe DiMaggio   293.5
Jimmy Foxx     291.8
Ed Delahanty   291.4
Ty Cobb        290.0
Sam Thompson   289.7
As you can see from the list the rating is biased towards players who played before 1901 with four making the list. I also produced a list of post 1900 leaders that went like so:
Babe Ruth      346.0
Ted William    342.1
Lou Gehrig     329.5
Joe DiMaggio   293.5
Jimmy Foxx     291.8
Ty Cobb        290.0
Hank Greenberg 287.7
Rogers Hornsby 280.4
Mel Ott        276.7
Tris Speaker   274.6
Here players who played prior to 1950 are given the nod.
Obviously there are many things wrong with this system not the least of which is that the weightings of the events are out of whack. The weights given to stolen bases, singles, doubles, and triples at the expense of homeruns and walks allows players from the 1800s and those in the deadball era to do well. Players from the 1950s and later are hurt even more by the -275 assigned to strikeouts - a weight that is equivalent to singles and greater than walks and that is wildly inaccurate. Simply put, strikeouts don't matter that much in the big scheme of things. One of the side bars in the book Mind Game makes the point well by showing that team strikeouts have little effect on total runs scored. The same can be said of stolen bases - a weapon that is strategic in nature.
In addition you'll also see that the weighting of runs scored and RBIs is out of whack since other systems don't take these into account at all. The reason is that they are highly dependent on the team context in which the player finds himself.
I've written a bit about the history of creating weights for offensive elements in a series of article on run estimation last year at this time.
- A Brief History of Run Estimation, Part I
- Run Estimation: Runs Created
- Run Estimation: Batting Runs
- Run Estimation: Estimated Runs Produced
- Run Estimation: Base Runs
Outside of the event weights the system suffers from a lack of context as well. You simply can't compare the raw offensive totals of players from different eras because the run environments in which they played differs. Hitting .400 in the 1930s is not the same thing as doing it in the 1960s as illustrated in this graph that shows the runs per game since 1901.

The same can be said of the park in which they played as mentioned previously. As a result the stats would have had to have been adjusted for the context before making comparisons. From an offensive perspective Michael Schell has taken the approach to its highest level in his books Baseball's All-Time Best Hitters and Baseball's All-Time Best Sluggers : Adjusted Batting Performance from Strikeouts to Home Runs.
Reading through these studies it became clear to me how much my thinking about baseball has been influenced by the writing of Bill James, Craig Wright, and Pete Palmer among others. Given the rise of personal computers and the information revolution, however, the kind of analysis they brought to the table was destined to occur. And that kind of analysis is now breeding a new way for teams to draft, shape their roster, and evaluate their talent.
125x125_10off+copy.jpg)


No comments:
Post a Comment