Today's column on BP talks about Win Expectancy and especially Keith Woolner's fine article "Adventures in Win Expectancy" in BP2K6. In that article Woolner provided a table and slopes and intercepts for calculating win expectancy for various offensive events in different run environments based on his Win Expectancy (WX) framework.
Since traditionally Win Expectancy is calculated directly from play by play data it's obviously only useful when PBP is available - which goes back to 1960 or so. I use the table to caculate WX back to 1876 and then show the results for individual seasons and careers so that Babe Ruth, Ty Cobb etc. can be included.
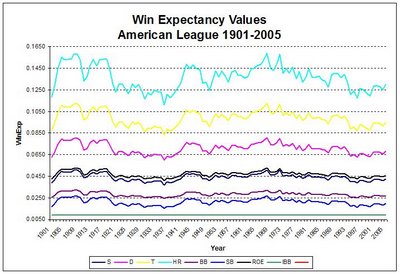
To give you a preview I also show a few graphs that map the WX for different offensive events over time. A graph that doesn't appear in the article, for the American League, is shown below.
The interesting aspect of course is that as the run environment declines, the WX for these events increases. Somewhat paradoxically, homeruns were worth more in the deadball era than today.
You'll need to subscribe to BP to see the rest... :)
Thursday, April 06, 2006
Wins and Environment
Posted by
Dan Agonistes
at
11:27 AM
![]()
Subscribe to:
Post Comments (Atom)

125x125_10off+copy.jpg)


No comments:
Post a Comment