FREE hit counter and Internet traffic statistics from freestats.com

Sunday, January 29, 2006

A Deeper Look at DER

In case you missed it you should check out Dave Studeman's article that looks deeper at Defensive Efficiency Rating - "Inside DER" over on THT.

One of the things that should be of interest to Cubs fans is his mention of Mark Prior's outs on ground ball rate. He shows that Prior's out percentage on ground balls was just 65.8% in 2004 whereas the league average, as I've mentioned before, is around 75%. He also has posted Prior's full stats on his wonderful baseball graphs site. What's interesting, of course, is that Prior is uncommon in that this appears to be consistent from year to year. For most pitchers this simply isn't the case as he says...

"Not surprisingly, pitchers who give up more line drives have lower DERs and those who have more infield flies have higher DERs. But the thing is, at least for this bunch of pitchers (2003-2005), batted-ball types weren't that important. The R-squared between batted-ball types and DER was only .10. That means that only 10% of the difference in pitcher DER could be explained by the types of batted balls they allowed. The other 90%? Well..."


I did a little digging and came up with the following table of out% on ground balls from some of the Cubs starters over the past few years (I've included errors as outs in order to discount that difference since indeed Prior has had more errors committed on grounders than other Cubs pitchers. You'll notice this raises the league average over 75% to the 76-79% range). The data is from BIS. The column "-Prior" shows the Cubs rate when you don't include Prior.

Year Prior Wood Maddux Zambrano Clement -Prior Lg
2003 0.761 0.781 - 0.792 0.829 0.786 0.785
2004 0.685 0.731 0.798 0.772 0.767 0.765 0.762
2005 0.745 0.821 0.796 0.801 - 0.774 0.767

So Mark Prior has been consistently the lowest, Greg Maddux and Carlos Zambrano consistently high. Kerry Wood and Matt Clement all over the map.

And that begs the question of why it is that Prior tends to give up more hits on groundballs?

What springs to mind are two contradictory theories.

The more likely I assume is that he gives up harder hit ground balls that end up making it through the infield. In Studeman's presentation of the data this is supported by the fact that his line drive rates are a bit higher than the ML average from 2002 through 2005. In watching him pitch this may be related to the fact that he tends to nibble so much early in the count that he often ends up throwing fastballs in 2-1 and 3-2 counts that are easier to hit hard.

But the inverse theory would hold that Prior allows more hits on grounders because he saws off more bats which results in more infield hits.

Which is true?

In thinking about this it occurred to me that in either case the play by play data we have is not sufficiently granular to determine between them. That's the case since at least some of the hard hit ground balls would be knocked down by infielders and so we wouldn't be able to tell whether a hit resulted from being a hard-hit shot that was knocked down by an infielder or a nubber that the infielder couldn't make a play on.

In any case I did a little more digging using PBP data from a different source and broke down the number of ground balls each pitcher gave up that were fielded by infielders and what percentage of those balls resulted in hits.

Balls Fielded by Infielders
Name GB H Pct
Greg Maddux 612 45 0.074
Kerry Wood 357 28 0.078
Matt Clement 462 29 0.063
Carlos Zambrano 795 64 0.081
Mark Prior 408 39 0.096

What you can see from this is that indeed in the period 2003-2005 Prior gave up infield hits 1.5% more often than any other Cubs pitcher and 2.3% more often than Greg Maddux on groundballs. But since we don't know how hard these balls were hit we don't know which theory is true.

Royals fans will notice that Jose Lima was near the top of Studeman's list with a ground out% of 82.6% in 2004. That certainly helps explain his "resurgent" season with the Dodgers and doesn't make Allard Baird look any better for signing him.

Cubs fans will also note that Glendon Rusch's fly ball out% of just 51.6% with the Brewers in 2003 made him a good pickup for the Cubs in 2004 as I noted in my earlier post on DIPS for 2005.

Friday, January 27, 2006

Fouls and More Fouls

I recently had the opportunity to look up some information on foul balls just for kicks.

Disclaimer: The foul balls tracked for this article do not include foul tips nor they do include foul balls that are caught by fielders. They do include both fouls that get into the stands and those that don't.

This data is for 2000-2004.

Top 10 hitters in fouls per time at bat (most likely to foul off a pitch when they're up)

 
Kevin Young 0.821
Johnny Estrada 0.819
Joe McEwing 0.798
Vance Wilson 0.783
Tomas Perez 0.775
Ruben Mateo 0.773
Mike DiFelice 0.771
Dante Bichette 0.757
Geronimo Gil 0.754
Scott Rolen 0.753


Bottom 10 Hitters in fouls per time at bat (least likely to foul off a pitch when they're up)

Lenny Harris 0.471
Mark Grace 0.470
Eric Young 0.468
Mark McGwire 0.467
Tom Goodwin 0.464
Mark McLemore 0.463
Jason Tyner 0.462
Covelli Crisp 0.458
Bill Haselman 0.447
Dave Roberts 0.443


Top 10 Pitchers (these are from 2000-2004 for pitchers that have faced more than 200 batters) in fouls per times at bat (most likely to have a pitch fouled off when they're pitching to a batter)
 
Guardado, Eddie 0.884
Percival, Troy 0.872
Springer, Russ 0.866
Francisco, Frank 0.861
Balfour, Grant 0.834
Rodriguez, Felix 0.829
Bedard, Erik 0.824
Baez, Danys 0.818
Donnelly, Brendan 0.816
Cotts, Neal 0.811


Bottom 10 Pitchers (least likely to have a pitch fouled off when they're pitching to a batter)

Cornelius, Reid 0.461
Miller, Matt 0.459
Halama, John 0.459
Tollberg, Brian 0.458
Wagner, Ryan 0.452
Eiland, Dave 0.450
Kamieniecki, Scott 0.443
Reyes, Carlos 0.415
Neu, Mike 0.410
Morgan, Mike 0.405


Top 10 hitters in fouls per pitch (most likely to foul off a pitch)

Johnny Estrada 0.245
A.J. Pierzynski 0.235
Toby Hall 0.223
Ivan Rodriguez 0.212
Dmitri Young 0.212
Dante Bichette 0.212
Ben Molina 0.212
Jay Gibbons 0.210
Ruben Mateo 0.210
Jose Vizcaino 0.208


Bottom 10 hitters in fouls per pitch (least likely to foul off a pitch)

Mark Johnson 0.127
Scott Hatteberg 0.125
John Olerud 0.124
Hideki Matsui 0.124
Randy Velarde 0.124
Todd Zeile 0.123
Tom Goodwin 0.120
Mark McGwire 0.119
Mark McLemore 0.117
Dave Roberts 0.115


Top 10 pitchers in fouls per pitch (most likely to foul off a pitch)

Guardado Eddie 0.226
Springer Russ 0.223
White Gabe 0.218
Rivera Mariano 0.218
Darensbourg Vic 0.218
Shaw Jeff 0.214
Kohlmeier Ryan 0.212
Hawkins LaTroy 0.211
Embree Alan 0.208
Acevedo Juan 0.207


Bottom 10 pitchers in fouls per pitch (least likely to foul off a pitch)

Jones Bobby M. 0.126
Orosco Jesse 0.126
Nance Shane 0.125
Reyes Carlos 0.123
Morgan Mike 0.123
Olson Gregg 0.122
Holtz Mike 0.122
Kamieniecki Scott 0.121
Wagner Ryan 0.120
Neu Mike 0.114

So if you took Johnny Estrada versus Eddie Guardado, theoretically the odds of a foul ball being hit on a pitch would be 32.2%. I say theoretically because of course Estrada may have lots of trouble hitting Guardado at all because of his particular repertoire of pitches or arm angle or whatever or he may hit him great and every swing is a line drive. That number was calculated using a formula Bill James discussed in his 1981 Baseball Abstract to calculate the theoretical batting average for specific batter/pitcher matchups, which as it turns out works very well.

In thinking about this though I did run the actual batter/pitcher matchups (where the batter had hit against the pitcher more than 15 times) for foul balls and found that the top 5 most foul balls per pitch (most likely to foul off a pitch) in last five years were:

Fouls Pitches PA Fouls/PA Fouls/Pitch
Carl Crawford vs Curt Schilling
24 57 17 1.412 0.421
Jay Payton vs Bruce Chen
24 61 15 1.600 0.393
Todd Hollandsworth vs Curt Schilling
37 100 19 1.947 0.370
Carlos Lee vs LaTroy Hawkins
24 65 16 1.500 0.369
Brandon Phillps vs Darrell May
19 52 15 1.267 0.365

So Crawford through 2004 has fouled off 42.1% of the pitches thrown to him by Schilling.

For ballparks Yankee Stadium had 20,637 foul balls hit there from 2000-2004 good for .666 per time at bat. The lowest was Oakland which had 18,520 for .593 per at bat. In Oakland at least I think that's due to the really large foul territory where fielders can catch the fouls before the ball enters the stands.

The average number of foul balls per game was about 48 in 2004. A park like Yankee Stadium would then get around 51 foul balls while in Oakland it would be more like 45 based on an average of 77 batters up in a game.

Tuesday, January 24, 2006

Luck Part II

I mentioned in a previous post that I would be posting an update to my article in the THT Baseball Annual 2006 titled "Are You Feeling Lucky?" on THT. I've done so and you can read all the details here. What it boils down to is that I made an Excel error in some of run totals and then took the opportunity to recalculate the projected runs scored and runs allowed using more customized versions of the BaseRuns formula.

I also noticed this post on Walk Like a Sabermetrician that shows an elegant way to estimate runs per wins and points out a typo in the original article which I did not catch.

There's also been some discussion of the article on Baseball Think Factory.

Sunday, January 22, 2006

The Weight of Glory

I didn't want to let this day pass without writing a few words related to the sanctity of life. This morning I heard a sermon that was one in a series related to the C.S. Lewis book The Lion, the Witch and the Wardrobe that had much to say on the subject.

In that sermon the pastor talked about Lewis' high view of humanity and how it is reflected in the fact that in Narnia as is related in Pslam 8:1-9, humans are the most exalted creatures below Aslan (Christ) and God himself (the Emperor Beyond the Sea). In Narnia the Sons of Adam (Edmund and Peter) and the Daughters of Eve (Susan and Lucy) are destined to be kings and queens just as followers of God are destined to someday be in His presence.

The pastor went on to explicate the ways in which this view of our real nature should impact our thinking. He first emphasized that we should be cognizant of our "royal" nature and how an understanding of our importance to God should give us security and rest while spurring us on to work for His kingdom. This is not a narcissistic view but a view of ourselves in proper perspective. This brings to mind one of my favorite sections in Lewis' The Screwtape Letters where the more experienced demon Screwtape writes to his nephew Wormwood on the subject of humility.

"You must therefore conceal from the patient the true end of Humility. Let him think of it not as self-forgetfulness, but as a certain kind of opinion (namely a low opinion) of his own talents and character. Some talents, I gather he really has. Fix in his mind the idea that humility consists in trying to believe those talents to be less valuable than he believes them to be. No doubt, they are less valuable than he believes, but that is not the point. The great thing is to make him value an opinion for some quality other than truth, thus introducing an element of dishonesty and make-believe into the heart of what otherwise threatens to become a virtue.

By this method thousands of humans have brought to think that humility means pretty women trying to believe they are ugly and clever men trying to believe they are fools. And since what they are trying to believe many, in some cases, be manifest nonsense, they cannot succeed in believing it, and we have the chance of keeping their minds endlessly revolving on themselves in an effort to achieve the impossible.

To anticipate the Enemy's strategy, we must consider His aims. The Enemy wants to bring the man to a state of mind in which he could design the best cathedral in the world, and know it to be the best, and rejoice in the fact, without being any more (or less) or otherwise glad at having done it than he would be if it had been done by another. The Enemy wants him, in the end, to be so free from any bias in his own favour that he can rejoice in his own talents as frankly and gratefully as in his neighbour's talents - or in a sunrise, an elephant, or a waterfall. He wants each man, in the long run, to be able to recognise all creatures (even himself) as glorious and excellent things."

Secondly, and more importantly for this Sunday, this proper view of our standing should turn outward towards a proper view of one another. He quoted one of my favorite passages in all the Lewis canon where Lewis explains what it means to take seriously the view that we are all potential "royalty". This section concludes the essay "The Weight of Glory", preached originally as a sermon in the Church of St Mary the Virgin, Oxford on June 8, 1942 and then published in THEOLOGY, November, 1941.

"It is a serious thing to live in a society of possible gods and goddesses, to remember that the dullest and most uninteresting person you talk to may one day be a creature which, if you saw it now, you would be strongly tempted to worship, or else a horror and a corruption such as you now meet, if at all, only in a nightmare. All day long we are, in some degree, helping each other to one or other of these destinations. It is in the light of these overwhelming possibilities, it is with the awe and the circumspection proper to them, that we should conduct all our dealings with one another, all friendships, all loves, all play, all politics.

There are no ordinary people. You have never talked to a mere mortal. Nations, cultures, arts, civilization - these are mortal, and their life is to ours as the life of a gnat. But it is immortals whom we joke with, work with, marry, snub, and exploit - immortal horrors or everlasting splendours. This does not mean that we are to be perpetually solemn. We must play. But our merriment must be of that kind (and it is, in fact, the merriest kind) which exists between people who have, from the outset, taken each other seriously - no flippancy, no superiority, no presumption. And our charity must be a real and costly love, with deep feeling for the sins in spite of which we love the sinner - no mere tolerance or indulgence which parodies love as flippancy parodies merriment. Next to the Blessed Sacrament itself, your neighbour is the holiest object presented to your senses. If he is your Christian neighbour he is holy in almost the same way, for in him also Christ vere latitat - the glorifier and the glorified, Glory Himself, is truly hidden."

And that is the reason sanctity of life Sunday is so important. The right to life is not and should not be viewed primarily as a political issue but rather a spiritual one. Human beings, made in the imago Dei or "image of God" bear the"weight of glory" and should therefore treat one another in that light. Surely, that includes defending those among us who cannot defend themselves.

Flights of the Mind

Well. I finally finished the 2004 biography of Leonardo da Vinci subtitled Flights of the Mind: A Biography by Charles Nicholl. I say finally because I received the book as a gift for Christmas 2004 and had been working my way through its' 500 pages very slowly the last six months. Until recently it was the book that sat by my bedside table and as a result, which I read a page or two at a time before falling asleep each night.

I had never read any biographies of Leonardo (1452-1519) before (although I did catch the recent show on his life on The History Channel) and so many of the biographical details were new to me. For example, I hadn't realized how much Leonardo moved around; from his early days as an apprentice in the studio of Verrochio in Florence (1467), to working for the Sforza ruler Ludovico in Milan (1482) for almost 20 years, from there to Mantua and back to Florence (1499), to Milan at the behest of the French governor (1506), to Rome (1513), and finally to France (1516) where he dies in 1519. I also had some inclination but didn't understand how much his career was shaped by the politics of the time, principally in the powerplay between the Medicis in Florence, the Sforzas in Milan, the French aristocracy, and the Papacy.

What he leaves behind in all of these moves are just a dozen or so completed works with many more apparently begun and never finished complete with various legal squabbles and half-promises he had to get out of. And while he fancied himself a military engineer, and sold himself as such to the Sforza's in Milan, he never actually got around to building anything of military import. He also seemed to shift his allegiances easily and didn't mind doing the bidding of less than sterling characters. One gets the impression that he was a man who couldn't stay focused on one task for long and so split his time and extraordinary intellect and talents between so many different projects that he rarely completed any of them. In fact, one is left to wonder whether if he hadn't been paid for his paintings, whether he would have finished even the ones he did. In one sense, then, I found the book a little sad in that while Leonardo certainly left a legacy in his painting, he could have had a much larger impact with his studies of paleontology, optics, flight, and especially anatomy had he simply seen fit to complete and publish his work - work that survived his death as several thousand hand-written pages in notebooks that were then scattered to the winds and not generally known or published until the 1800s.

I remember viewing one of the folios at a traveling exhibit at the Houston Museum of Art in the early 1990s and was enthralled with Leonardo's sketches of futuristic devices including a kind of helicopter I believe. At the time I couldn't get my mind around how such an intellectual giant couldn't have influenced his time and ours more than he did. Reading Nicholl's biography helps me understand just how it happened. By the way, some may be wondering as I did about the origin and use of Leonardo's mirror writing. Nicholl disposes of this topic in one sentence and notes that most scholars simply think that Leonardo, who enjoyed no formal schooling, taught himself to write this way and being left-handed found it more natural to do so backwards.

As to the book itself, Nicholl is clearly at heart an art historian and spends much time on the composition, background, and history of each of the authenticated Leonardo works and on many of the studies in his notebooks. His descriptions of the materials used in the creation of the work along with the details of the context in which each was painted are prodigious. He's clearly most comfortable when pointing out the similarities of one work to another and tracing the evolution of Leonardo's works such as the Mona Lisa and St. John the Baptist, sometimes decades before they actually made it onto canvas. He also does a masterful job of piecing together clues from biographies of Leonardo starting with Vasari's done in the mid 1500s and seemingly every letter or official document that mentions Leonardo during his lifetime. He uses these clues to piece together Leonardo's activities and whereabouts at almost anytime and seems to make plausible assumptions where the data is missing. The level of detail in these areas makes the book worth reading.

I also liked the fact that he did not delve into the various conspiracies or mysteries surrounding Leonardo. For example, he examines the evidence and concludes that the subject of the Mona Lisa is indeed the young mother Lisa Giaconda from Florence, as early biographers insisted. This no-nonsense approach was refreshing and gave the book an air of authority that would, for my anyway, would have been otherwise lacking.

Where the book suffers in my opinion is the lack of analysis regarding anything Leonardo did outside of art and his penchant for putting Leonardo on his couch and performing his Freudian analysis.

Regarding the first area, although the book is subtitled "Flights of the Mind" and Nicholl mentions that Leonardo felt that to fly was "his destiny", Nicholl spends precious little time, just 15 pages, on Leonardo's drawings and contemplation of flight. He mentions that there is some evidence based on a passage in one of the notebooks and one external source, that Leonardo actually built and attempted to fly one of his machines while in Milan but includes little analysis of the actual machines themselves. He tantalizingly mentions that Leonardo was moving towards a fixed-wing design (all of Leonardo's designs had flapping wings) but leaves us hanging as to the evidence for such a move. He similarly is almost silent on Leonardo's military machines including the famous submarine and tank, not to mention the catapults and other devices.

In fact, after finishing the book this morning I re-read the essay "The Upwardly Mobile Fossils of Leonardo's Living Earth" by Stephen Jay Gould published in his 1998 compilation Leonardo's Mountain of Clams and the Diet of Worms. I would have to say that in Gould's 28 page essay I learned more about the content of the Codex Leceister (the notebook that contains Leonardo's view of geophysics compiled in the period 1507-1510 and purchased by Bill Gates in the late 1990s) than in Nicholl's book. Gould does an excellent job of putting Leonardo in the context of his time and showing that Leonardo's correct interpretation of what fossils are, how strata can be correlated across river valleys, how to interpret fossils clam evidence and more relate to his desire to validate his theory of the earth as a macrocosm of the human body. This view is entirely medieval and shows how Leonardo was indeed a product of his time. In any case, the essay succinctly describes Leonardo's views and arguments in the Codex Leceister that Nicholl doesn't even begin to touch on. In fact, I'm surprised that Nicholl doesn't reference Gould since Gould's analysis of Leonardo's theory of the earth, I believe, was unique.

Finally, Nicholl is most disappointing in his treatment of Leonardo's studies of anatomy. It would seem from the book that Leonardo felt as if publishing a book of anatomy such as the one Vesalius (1514-1564) published 25 years after Leonardo's death (1543, De humani corporis fabrica libri septum or "On the fabric of the human body in seven books") was to be his Magnum Opus. Unfortunately, Nicholl leaves us wondering just how much and to what level of detail Leonardo had developed this work (I since learned that he made over 750 anatomical drawings and correctly portrayed the structure of the heart, including the valves and the coronary vessels). Nicholl does mention repeatedly that Leonardo engaged in dissections (at least 30 according to a visitor of Leonardo's during his final year) and how this may have been viewed by others. But aside from showing some of the drawings we never discover, for example, whether Leonardo presaged the discovery of the circulation of the blood by William Harvey in his 1628 book De motu cordis et sanguinis. It would seem from Leonardo's theory of the earth explicated by Gould that Leonardo would have had at least a strong suspicion of this fact. In any case, the entire subject is poorly treated in Nicholl's book.

As an aside I was able to view copies of both Vesalius and Harvey's work in the John Martin Rare Book Room at the health sciences library at the University of Iowa. Doing so was an absolute treat.

But probably more disturbing, since I can forgive an author for going with his strength, is Nicholl's constant Freudian over-analysis. It starts early with a dream that Leonardo recounts of a bird near his crib all the way to the painting of St. John the Baptist near the end of this life and doesn't let up in between. Applying pop-psychology to a man who has been dead 500 years and from another culture seems a little bit presumptuous if you ask me. And yes, he treats Leonardo's supposed homosexually and throws it into the mix.

To give you a feel for some of this, the following is a passage where Nicholl's is describing the painting of John the Baptist and it's connection with a later picture of the god Bacchus and a drawing in one of the notebooks known as Angelo incarnato.

"The Lourve painting [St. John] retains an almost poignant trace of the homosexual come-hither - and the likeness of the face to an idealized image of Salai [Leonardo's longtime assistant] anchors this to Leonardo's personal life - but it is subsumed into the numinous lustre of the painting. The tone of malady and corruption in the Angelo incarnato has been healed bu those magical 'oils and plants' distilled at the Belvedere [the location of the painting in Rome]. Slowly, soothingly, repeatedly, they are applied to the panel, layer by superfine layer, until the figure we see there - at once sexual and spiritual, masculine and feminine, sinner and saint - seems to resolve all the conflicts of our divided and irresolute lives."

Umm...right.

Well, if you can look past such drivel you just might enjoy the book as well.

Wednesday, January 18, 2006

Tagging Up

As a companion to my article "To Go or Not to Go?" over at THT, I offer the complete data for the outfielders. Listed are the outfielders with 15 or more caught fly balls at any one position with a runner on third and fewer than two outs that did not result in either a hit or a dropped-ball error on the outfielder (this includes throwing errors).

The main idea of the tables is to get a feeling for how an outfielder's arm affects a third base coach's decision as to whether he will send a runner from third in a sacrifice fly situation. The Hold% reflects this while the Succ% indicates how often the runner scores.


Name POS Opp Hold Hold% SF DP DP% Succ%
Ichiro Suzuki RF 59 22 0.373 33 4 0.068 0.892
Carlos Lee LF 49 12 0.245 35 2 0.041 0.946
Carl Crawford LF 46 5 0.109 41 0 0.000 1.000
Gary Sheffield RF 43 5 0.116 35 3 0.070 0.921
Juan Encarnacion RF 43 12 0.279 30 1 0.023 0.968
Raul Ibanez LF 41 12 0.293 26 3 0.073 0.897
Manny Ramirez LF 41 12 0.293 29 0 0.000 1.000
Hideki Matsui LF 39 6 0.154 32 1 0.026 0.970
Richard Hidalgo RF 38 10 0.263 24 4 0.105 0.857
Magglio Ordonez RF 36 6 0.167 30 0 0.000 1.000
Pat Burrell LF 35 9 0.257 24 2 0.057 0.923
Adam Dunn LF 35 9 0.257 26 0 0.000 1.000
Jermaine Dye RF 34 8 0.235 24 2 0.059 0.923
Bobby Abreu RF 34 9 0.265 25 0 0.000 1.000
Trot Nixon RF 33 10 0.303 23 0 0.000 1.000
Luis Gonzalez LF 32 11 0.344 20 1 0.031 0.952
Rondell White LF 30 3 0.100 26 1 0.033 0.963
Shawn Green RF 30 5 0.167 24 1 0.033 0.960
Vladimir Guerrero RF 30 6 0.200 22 2 0.067 0.917
Alexis Rios RF 30 8 0.267 19 3 0.100 0.864
Jason Bay LF 29 1 0.034 27 1 0.034 0.964
Brian Giles RF 29 8 0.276 19 2 0.069 0.905
Miguel Cabrera LF 28 4 0.143 20 4 0.143 0.833
Barry Bonds LF 28 6 0.214 22 0 0.000 1.000
Cliff Floyd LF 28 7 0.250 20 1 0.036 0.952
Brady Clark RF 27 2 0.074 23 2 0.074 0.920
Shannon Stewart LF 27 2 0.074 25 0 0.000 1.000
Randy Winn LF 27 4 0.148 23 0 0.000 1.000
Moises Alou LF 27 4 0.148 23 0 0.000 1.000
Larry Walker RF 27 7 0.259 20 0 0.000 1.000
Jose Cruz RF 26 4 0.154 22 0 0.000 1.000
Larry Bigbie LF 26 7 0.269 19 0 0.000 1.000
Bobby Higginson RF 25 5 0.200 19 1 0.040 0.950
Coco Crisp LF 25 5 0.200 19 1 0.040 0.950
Sammy Sosa RF 25 6 0.240 19 0 0.000 1.000
Craig Monroe LF 25 6 0.240 19 0 0.000 1.000
Jeromy Burnitz RF 25 7 0.280 18 0 0.000 1.000
Jose Guillen RF 25 9 0.360 15 1 0.040 0.938
Austin Kearns RF 24 0 0.000 22 2 0.083 0.917
Dustan Mohr RF 24 4 0.167 19 1 0.042 0.950
Matt Holliday LF 24 4 0.167 20 0 0.000 1.000
Eric Byrnes LF 24 5 0.208 17 2 0.083 0.895
J.D. Drew RF 24 5 0.208 19 0 0.000 1.000
Jacque Jones RF 24 7 0.292 17 0 0.000 1.000
Craig Monroe RF 24 10 0.417 13 1 0.042 0.929
Jay Gibbons RF 23 4 0.174 18 1 0.043 0.947
Danny Bautista RF 23 9 0.391 14 0 0.000 1.000
Garret Anderson LF 21 4 0.190 16 1 0.048 0.941
Aubrey Huff RF 21 4 0.190 17 0 0.000 1.000
Geoff Jenkins LF 21 6 0.286 13 2 0.095 0.867
Matt Lawton RF 20 3 0.150 17 0 0.000 1.000
Brad Wilkerson LF 20 9 0.450 8 3 0.150 0.727
Ryan Klesko LF 19 3 0.158 15 1 0.053 0.938
Jody Gerut RF 19 5 0.263 13 1 0.053 0.929
Raul Mondesi RF 19 7 0.368 11 1 0.053 0.917
Jay Payton LF 18 2 0.111 16 0 0.000 1.000
Kevin Mench LF 18 5 0.278 12 1 0.056 0.923
Michael Tucker RF 17 2 0.118 15 0 0.000 1.000
Lance Berkman LF 17 3 0.176 14 0 0.000 1.000
Lew Ford LF 17 4 0.235 13 0 0.000 1.000
Jose Guillen LF 17 6 0.353 10 1 0.059 0.909
Reed Johnson RF 16 0 0.000 15 1 0.063 0.938
David Dellucci LF 16 3 0.188 12 1 0.063 0.923
Gabe Kapler RF 16 3 0.188 13 0 0.000 1.000
Jason Lane RF 16 4 0.250 12 0 0.000 1.000
Terrence Long LF 16 5 0.313 11 0 0.000 1.000
Matt Lawton LF 16 5 0.313 11 0 0.000 1.000
Geoff Jenkins RF 15 5 0.333 7 3 0.200 0.700


Name POS Opp Hold Hold% SF DP DP% Succ%
Carlos Beltran CF 69 9 0.130 59 1 0.014 0.983
Johnny Damon CF 63 4 0.063 57 2 0.032 0.966
Juan Pierre CF 63 6 0.095 55 2 0.032 0.965
Jim Edmonds CF 56 9 0.161 44 3 0.054 0.936
Vernon Wells CF 55 3 0.055 51 1 0.018 0.981
Mark Kotsay CF 54 5 0.093 45 4 0.074 0.918
Andruw Jones CF 53 9 0.170 42 2 0.038 0.955
Rocco Baldelli CF 47 7 0.149 37 3 0.064 0.925
Bernie Williams CF 43 0 0.000 42 1 0.023 0.977
Steve Finley CF 43 3 0.070 37 3 0.070 0.925
Aaron Rowand CF 41 7 0.171 34 0 0.000 1.000
Luis Matos CF 41 8 0.195 31 2 0.049 0.939
Scott Podsednik CF 40 7 0.175 33 0 0.000 1.000
Torii Hunter CF 40 12 0.300 26 2 0.050 0.929
Marquis Grissom CF 38 0 0.000 36 2 0.053 0.947
Mike Cameron CF 38 7 0.184 31 0 0.000 1.000
Kenny Lofton CF 38 9 0.237 27 2 0.053 0.931
Milton Bradley CF 37 6 0.162 29 2 0.054 0.935
Ken Griffey CF 36 2 0.056 34 0 0.000 1.000
Preston Wilson CF 35 2 0.057 33 0 0.000 1.000
Alex Sanchez CF 33 5 0.152 28 0 0.000 1.000
Corey Patterson CF 32 3 0.094 29 0 0.000 1.000
David DeJesus CF 31 5 0.161 26 0 0.000 1.000
Gary Matthews CF 31 6 0.194 25 0 0.000 1.000
Tike Redman CF 28 3 0.107 25 0 0.000 1.000
Brad Wilkerson CF 27 4 0.148 22 1 0.037 0.957
Nook Logan CF 25 1 0.040 23 1 0.040 0.958
Jay Payton CF 25 6 0.240 18 1 0.040 0.947
Randy Winn CF 24 1 0.042 21 2 0.083 0.913
Coco Crisp CF 22 2 0.091 19 1 0.045 0.950
Craig Biggio CF 22 2 0.091 20 0 0.000 1.000
Jeremy Reed CF 20 1 0.050 19 0 0.000 1.000
Laynce Nix CF 19 1 0.053 18 0 0.000 1.000
Dave Roberts CF 19 2 0.105 17 0 0.000 1.000
Wily Mo Pena CF 19 4 0.211 15 0 0.000 1.000
Grady Sizemore CF 18 1 0.056 16 1 0.056 0.941
Endy Chavez CF 18 2 0.111 14 2 0.111 0.875
Marlon Byrd CF 18 2 0.111 16 0 0.000 1.000
Brady Clark CF 18 3 0.167 15 0 0.000 1.000

Hardball Times Baseball Annual 2006 Reviews

There have been a few reviews of the book I contributed to you might want to check out. The most comprehensive was just posted by Chris Jaffe over at BTF. Chris hit the nail on the head with my article "Are You Feeling Lucky?" and I'll be posting some tweaks to it in the coming days.

Some other reviews...

Nats Blog

Mets Geek

Jay's Giants Blog

Many Go; Few Understand

Stats and Strikes

Here are a couple of interesting topics...

First, a co-worker reminded me that MLB and fantasy leaguers are in conflict over licensing the statistics. Wondering how this might affect others, like THT and Baseball Prospectus who profit from the stats...hmmm

Second, check out the article Mapping the Strikezone by David Appelman on THT. Wonderful graphs with pitch data from 2005. His first two graphs validates, but only a little, the conventional wisdom that left-handed hitters like the ball down or out over the plate while right-handed hit the inside pitch better. Very cool.

Sunday, January 15, 2006

OPS as a Run Estimator

Thanks to everyone who emailed me regarding my article on THT, "Run Estimation for the Masses". A couple of comments.

First, I noted in the article that:

"some analysts have noted, as discussed by Michael Lewis in Moneyball, that each point of On-Base Percentage is more valuable than each point of Slugging Percentage. How much more has been the topic of some discussion over the years, but a multiplier of 1.8 has been suggested. This turns out to be the value that results in the maximum correlation coefficient."

That is indeed the case. Using the 1.8 weighting produced a correlation coefficient of .959417 that was even higher than BRA and all but BsR, XRR, RC, and XR. I forgot to include a link to an post I wrote awhile back on this topic titled DePodesta and OPS that explores some of the recent research that has been done on the topic.

It turns out that the November 2005 issue of SABR's By The Numbers also has two more articles on this topic, one by Mark Pankin and the other by Donald A. Coffin and Bruce Cowgill. In Pankin's article he uses two different approaches to calculate the "marginal value ratio" or MVR of OBP to SLUG and finds that both result in a value of around 2.0 depending on the team and league context. Coffin and Cowgill used regression analysis and came up with a value of 1.90 using data from 1987-2004 with a higher value in the NL (2.03) than in the AL (1.72). What was interesting, however, is that their values differed wildly from year to year with a low value of .37 in 1990 to a high value of 4.71 in 2000. They chalk this up to small sample sizes for individual seasons.

Some have argued that perhaps DePodesta used an MVR of 3.0 simply because OBP is calcuated on a scale of 1.0 and SLUG is on a scale of 4.0 on the basis that a team of players who had an OBP of 1.000 would score an infinite number of runs while a team of players with a SLUG of 1.000 would still make outs and therefore score fewer runs. I doubt this was the case and think that perhaps DePodesta's conclusion stemmed from creating a model (perhaps using regression analysis) using a smaller sample size, perhaps from a season like 2001, where the value using regression analysis is 3.55 as calculated by Coffin and Cowgill.

A second point of interest came from reader Moshe Koppel that offered another OPS' type formula that does a better job of measuring run production per out made rather than per plate appearance. The formula is:

OPS'' = OPS/(1-OBP)

Using this formula against the 2000-2004 dataset yields a correlation coefficient of .959129, a value higher than OPS but just under the OPS' I used in the article.

Last Time, I Promise

I know I said in an earlier post that I'd put the topic of sacrificing to bed for this offseason but I just had to address one more issue raised in the discussion of the article "Sacrificing in 2005 Redux" at "Primery Numbers" on Baseball Think Factory (and I apologize for not participating in these discussions but I always forget to go look for them after I post an article).

The comment that spurred this post went like this:

"Shouldn't those "bunting frequency by score differential" be normalised by "bunting opportunities by score differential."

Do managers bunt more often in close games because the bunt a greater %ge of the time when the score is closer (which is what is implied), or is it just that there are more close games than blowouts, (and even blowouts start close)?"


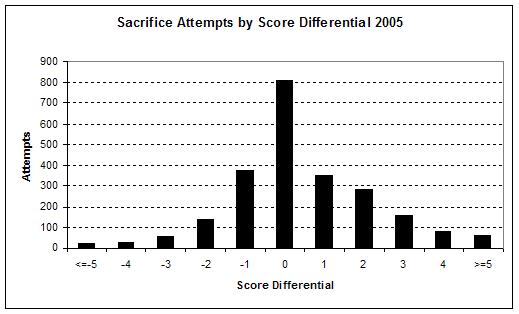
What the questioner is referring to is a table and accompanying chart that lists the number of sacrifice attempts by score differential for 2005. That data shows that managers bunt more than twice as often with the score tied than when being ahead a run or behind a run as shown in the graph.


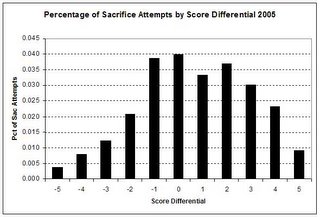
Of course the questioner is correct that this doesn't show a true picture since it omits the opportunities the manager had to sacrifice. So I reran the numbers, this time including the number of plate appearances with runners on base by score differential and then calculated a percentage of sacrifice attempts for each. The graph follows.


Diff Runners On SacAtt PctAtt SuccPct
<=-5 5591 21 0.004 0.909
-4 2946 23 0.008 0.739
-3 4426 54 0.012 0.722
-2 6653 138 0.021 0.725
-1 9763 377 0.039 0.769
0 20293 809 0.040 0.782
1 10567 352 0.033 0.730
2 7677 284 0.037 0.771
3 5217 158 0.030 0.747
4 3465 80 0.023 0.800
>=5 6527 59 0.009 0.750

And the graph.


What this shows is that managers in 2005 bunted as often when down by a run as when tied and just slightly less when ahead by 1,2, or 3 runs before forgoeing the sacrifice. It also shows that they sacrifice much less often when down by 2 runs than when down by 1. Apparently, the 2 run deficit is viewed much differently than the one run.

Wednesday, January 11, 2006

The Winter of Cedeno

Ronnie Cedeno may make Dusty's decision at shortstop this spring a difficult one.

Here's his line in the Venezuelan Winter League as reported by Baseball America this morning.


TM PLAYERS AB R H BI BB SO AVG
CHC R.Cedeno SS 7 2 4 3 0 0 .375 - 3B, E

As we know he'll need to continue hitting like this if he wants to take a job from a "proven veteran" like Neifi Perez.

And speaking of the spring my buddy Ron, his son, and his brother Harry will be And heading to sunny Arizona the weekend of March 17 to take in two Cubs and two Royals games in Surprise, Mesa, and Tuscon. Hope to see you there.

Tuesday, January 10, 2006

Minor and Major Closers

A couple odds and ends today.

Not being a fantasy league player, this is the first year I've purchased Ron Shandler's Baseball Forecaster and I have to say that I'm thoroughly enjoying it. I especially enjoyed his Toolbox which condenses many sabermetric ideas into a short space. Here was one that while I had heard before, I had never actually seen the numbers.

"Projecting Saves: Origin of Closers
...From 1990-2004, there were 280 twenty-save performances in Double-A and Triple-A, accomplished by 254 different pitchers.

Of those 254, only 46 ever made it to the majors.
Of those 46, only 13 ever posted a 20-save season.
Of those 13, only 5 ever posted more than one 20-save season: John Wettland, Mark Wohlers, Ricky Battalico, Braden Looper, and Francisco Cordero.

Five pitchers out of 254, a rate of barely 2%."

Intuitively, this is what you'd expect but not, I don't believe, for the reason Shandler notes. He says in this section that one of the reasons "that minor league closers rarely become major league closers is because, in general, they do not get enough innings in the minors to sufficiently develop their arms into big-league caliber."

While this may be a small contributing factor, my first thought is that generally young pitchers with the best stuff come through the system as starters. As a result pitchers who are relievers in the minors are generally less talented and therefore have a much smaller chance of making the big leagues. They also pitch fewer innings of course which is a result of their inferior talent, not a reason their arms don't develop. And of course the reason the most talented pitchers remain starters in the minor leagues is that teams want to see their prospects throw and because having a great closer in the minors is far less important than it is in the majors.

Also, just noticed today that version 5.3 of the Lahman database is now available for download. I couldn't live without it.

And I would be remiss if I didn't mention that former Cub Bruce Sutter was elected to the Hall of Fame today by being named on 76.9% of the ballots. He'll go in with Tracy Ringolsby who received the Spink Award.

Sutter is the first "pure reliever" to be elected, meaning a pitcher who never started a game in his career. He finished 512 of the 661 games he pitched in racking up 300 saves exactly. It should be noted, however, that Dennis Eckersley, Hoyt Wilhelm, and Rollie Fingers would not have been elected had they not been converted to relievers.

Former Cubs Rich Gossage, another started later converted to a reliever received 336 votes, good for 64.6%, Andre Dawson was at 317 and 61%, and Lee Smith came in with 234 and 45%.

It's interesting that Sutter was elected on the strength of just eight seasons (1976-1982,1984) out of the 12 seasons he played. His Black Ink, Gray Ink, HOF Standards, and HOF Monitor ratings you can find on BaseballReference.com are mostly low with the exception of the HOF Monitor but of course being a pure reliever makes it difficult to use these tools.

With Sutter now in one can make an excellent case that Gossage should be elected as well. He also had seven or eight excellent seasons and pitched more and worked harder for his 310 saves. Smith should also get more consideration, if only because he record 178 more saves than Sutter. In the end though, Sutter was elected not primarily because of his raw statistics, but because he helped usher in the new reliever usage pattern that is dominant today where closer is a defined role and relegated to the ninth inning and because he popularized the split-fingered fastball.

It was unfortunate that "The Hawk" didn't get more consideration since next year Tony Gwynn, Cal Ripken Jr. and Mark McGwire are eligible. Gwynn and Ripken are shoe-ins of course but I'm betting that McGwire will have to wait a few years. I always liked Dawson as a player despite his penchant for chasing bad balls and not walking (never more than 44 times). He was a good fielder and I remember marveling at his cannon arm when we would visit Wrigley Field in the late 1980s. Once he even almost killed me with a line shot foul ball down the left field line. Only the seat in front of me saved me as I was mesmerized by the speed and curve on the ball.

His stats say he's a marginal Hall of Famer at best but the Cub in me was pulling for him.

Update 1/11: Here's Aaron Gleeman's take on the balloting. He makes a good case for Gossage. I think that perhaps Gossage and Sutter are closer than their career numbers would imply since the Goose's effective seasons ended after 1985 and so his last 450 inning were basically league average. He also recorded just 26 saves after his 1988 season with the Cubs. So roughly, their peak years were very similar.

Monday, January 09, 2006

Journal of Quantitative Analysis in Sports

This looks like a promising place to find some interesting analysis of Baseball and Football. In the first issue there's an article by Aaron Schatz on "Football's Hilbert Problem" that explores some of the data collection and analysis issues that football analysts encounter. Interesting stuff.

Sunday, January 08, 2006

Graphs and More Graphs

For those looking for good baseball sites, there's a new one by SABR member Alex Resiner that does some excellent graphing. Enjoy.

Thursday, January 05, 2006

Holding Down the Sacrifice

As promised I posted a few refinements and explanation on my article Not So Sweet Surrender in a new article titled Sacrificing in 2005 Redux over at THT.

Probably the most interesting conclusion there was that pitchers sacrifice percentages are almost 20% lower than position players. However, when you take into account the low percentage attempts with two strikes which result in strikeouts 70% of the time, the difference shrinks to around 7 to 8%. One interested reader pointed out that while this difference might be mostly due to the fact that pitchers simply don't bunt as well, it may also be that defenses play more aggressively when a pitcher is in a sacrifice situation. The third and first baseman sometimes are sitting right on top of the pitcher when he bunts, turning any sub-optimal bunt into a potential force out or double play. That makes a great deal of sense to me.

To pretty much wrap up this subject and get on with other things, I took a look at the sacrifice percentage against pitchers in the 2003-2005 period. What follows are those pitchers who had 20 or more attempts against them and the percentage of successful sacrifices.


Att Succ Pct
John Thomson 22 21 0.955
Sidney Ponson 20 19 0.950
Jamie Moyer 27 25 0.926
Roberto Hernandez 23 21 0.913
Mark Buehrle 23 21 0.913
Tim Hudson 34 31 0.912
Rick White 21 19 0.905
Shawn Chacon 31 28 0.903
Eric Milton 20 18 0.900
Jae Seo 36 32 0.889
CC Sabathia 26 23 0.885
David Wells 25 22 0.880
Vicente Padilla 32 28 0.875
Kenny Rogers 24 21 0.875
Tom Glavine 47 41 0.872
Bartolo Colon 23 20 0.870
Greg Maddux 53 46 0.868
Shawn Estes 45 39 0.867
Barry Zito 30 26 0.867
Kyle Lohse 22 19 0.864
Freddy Garcia 22 19 0.864
Matt Morris 38 32 0.842
Cory Lidle 43 36 0.837
Ismael Valdez 24 20 0.833
Brad Radke 29 24 0.828
Jim Brower 23 19 0.826
Salomon Torres 22 18 0.818
David Weathers 22 18 0.818
Mike Maroth 32 26 0.813
Kip Wells 37 30 0.811
Nate Robertson 21 17 0.810
Jon Lieber 21 17 0.810
Wilson Alvarez 20 16 0.800
Jake Westbrook 20 16 0.800
Glendon Rusch 35 28 0.800
Byung-Hyun Kim 20 16 0.800
Jeff Suppan 39 31 0.795
Derek Lowe 34 27 0.794
Paul Wilson 29 23 0.793
Todd Jones 24 19 0.792
Jason Jennings 37 29 0.784
Brett Myers 32 25 0.781
Horacio Ramirez 36 28 0.778
Esteban Loaiza 27 21 0.778
Aaron Harang 40 31 0.775
Jon Garland 31 24 0.774
Wayne Franklin 26 20 0.769
Julian Tavarez 21 16 0.762
John Lackey 21 16 0.762
Jeff Fassero 21 16 0.762
Chris Capuano 29 22 0.759
Carl Pavano 29 22 0.759
Odalis Perez 41 31 0.756
Mike Hampton 32 24 0.750
Luis Ayala 20 15 0.750
Jerome Williams 32 24 0.750
Hideo Nomo 36 27 0.750
Chris Carpenter 20 15 0.750
Josh Fogg 31 23 0.742
Jeff Weaver 31 23 0.742
Brandon Backe 23 17 0.739
Kevin Millwood 42 31 0.738
Brian Lawrence 38 28 0.737
Curt Schilling 26 19 0.731
Kazuhisa Ishii 35 25 0.714
Joe Kennedy 21 15 0.714
Roy Oswalt 48 34 0.708
Andy Pettitte 24 17 0.708
Woody Williams 41 29 0.707
Steve Trachsel 30 21 0.700
Brett Tomko 40 28 0.700
Kris Benson 23 16 0.696
Livan Hernandez 52 36 0.692
Randy Wolf 29 20 0.690
Miguel Batista 29 20 0.690
Mark Redman 45 31 0.689
Mark Mulder 35 24 0.686
Jason Schmidt 35 24 0.686
Giovanni Carrara 22 15 0.682
Claudio Vargas 22 15 0.682
Carlos Silva 25 17 0.680
Jason Johnson 28 19 0.679
Adam Eaton 34 23 0.676
Josh Beckett 37 25 0.676
Javier Vazquez 37 25 0.676
Jake Peavy 27 18 0.667
Carlos Zambrano 50 33 0.660
Oliver Perez 29 19 0.655
Doug Davis 49 32 0.653
Elmer Dessens 23 15 0.652
Kirk Rueter 37 24 0.649
Brandon Webb 54 35 0.648
Tim Redding 34 22 0.647
Al Leiter 45 29 0.644
Matt Clement 28 18 0.643
Ben Sheets 39 25 0.641
Kevin Brown 25 16 0.640
Mark Prior 36 23 0.639
Russ Ortiz 33 21 0.636
Randy Johnson 30 19 0.633
Kerry Wood 30 19 0.633
Noah Lowry 24 15 0.625
Dontrelle Willis 40 25 0.625
AJ Burnett 24 15 0.625
Roger Clemens 34 21 0.618
Tomo Ohka 31 19 0.613
Brad Penny 28 17 0.607
Jason Marquis 22 10 0.455

Perusing the list you can probably tell that there are more soft tossers in the top half and more hard throwers in the bottom. This is in fact borne out when you split the list into two groups. In one group put those who had a percentage of .75 and higher and in the other those with lower than .75 and you get.

Count Pct K/9 BB/9
High Sac Pct 58 .825 5.82 2.60
Low Sac Pct 50 .670 6.85 2.80

The difference between strikeout rates climbs when you make the cutoffs >=.85 and < .65 where they are 7.24 and 6.03 respectively.

This squares with our common sense expectation. Among the many other benefits of a 94mph fastball is that it makes it more difficult for hitters to lay down bunts.